| Decision Outcomes in Hypothesis Testing | ||
| \[H_0\text{ True}\] | \[H_0\text{ False}\] | |
|---|---|---|
| \[\text{Reject }H_0\] | \[\text{Type I Error }(\alpha)\] | \[\text{Correct Decision}\\1-\beta\] |
| \[\text{Fail to Reject } H_0\] | \[\text{Correct Decision}\\1-\alpha\] | \[\text{Type II Error } (\beta)\] |
One-Sample T-Test
PSY 348: Lecture 9
Dave Brocker
Farmingdale State College
Recap
How did we get here?
straighten
Measurement
Measuring abstract concepts
category
Variables
Types and scales
show_chart
The Normal Curve
Probability from z-scores
groups
Sampling Theory
Distribution of sample means
If we can estimate the probability that a sample mean came from a particular distribution, can we also estimate whether it came from the null or the alternative hypothesis?
From Probability to Decision-Making
Once we know how likely a sample mean is to occur, we can begin to make decisions about what that likelihood means.
We introduced two competing ideas:
Null hypothesis \(H_0\)
No real difference or effect.
Alternative hypothesis \(H_1/H_A\)
A true difference or effect exists.
- Because samples vary, we can never be 100% certain, only confident to a degree.
Errors in Estimation
Type I and II Error
That degree of confidence is defined by \(\alpha\) (alpha), our threshold for error when rejecting \(H_0\).
\(\beta\) (beta) is the probability of missing a real effect (failing to reject \(H_0\) when \(H_1\) is true).
- Type I Error (\(\alpha\))
- Finding a difference that isn’t really there. (False Positive)
- Type II Error (\(\beta\))
- Missing a difference that actually exists. (False Negative)
The Truth Table
Alpha and Beta
Seeing the two errors
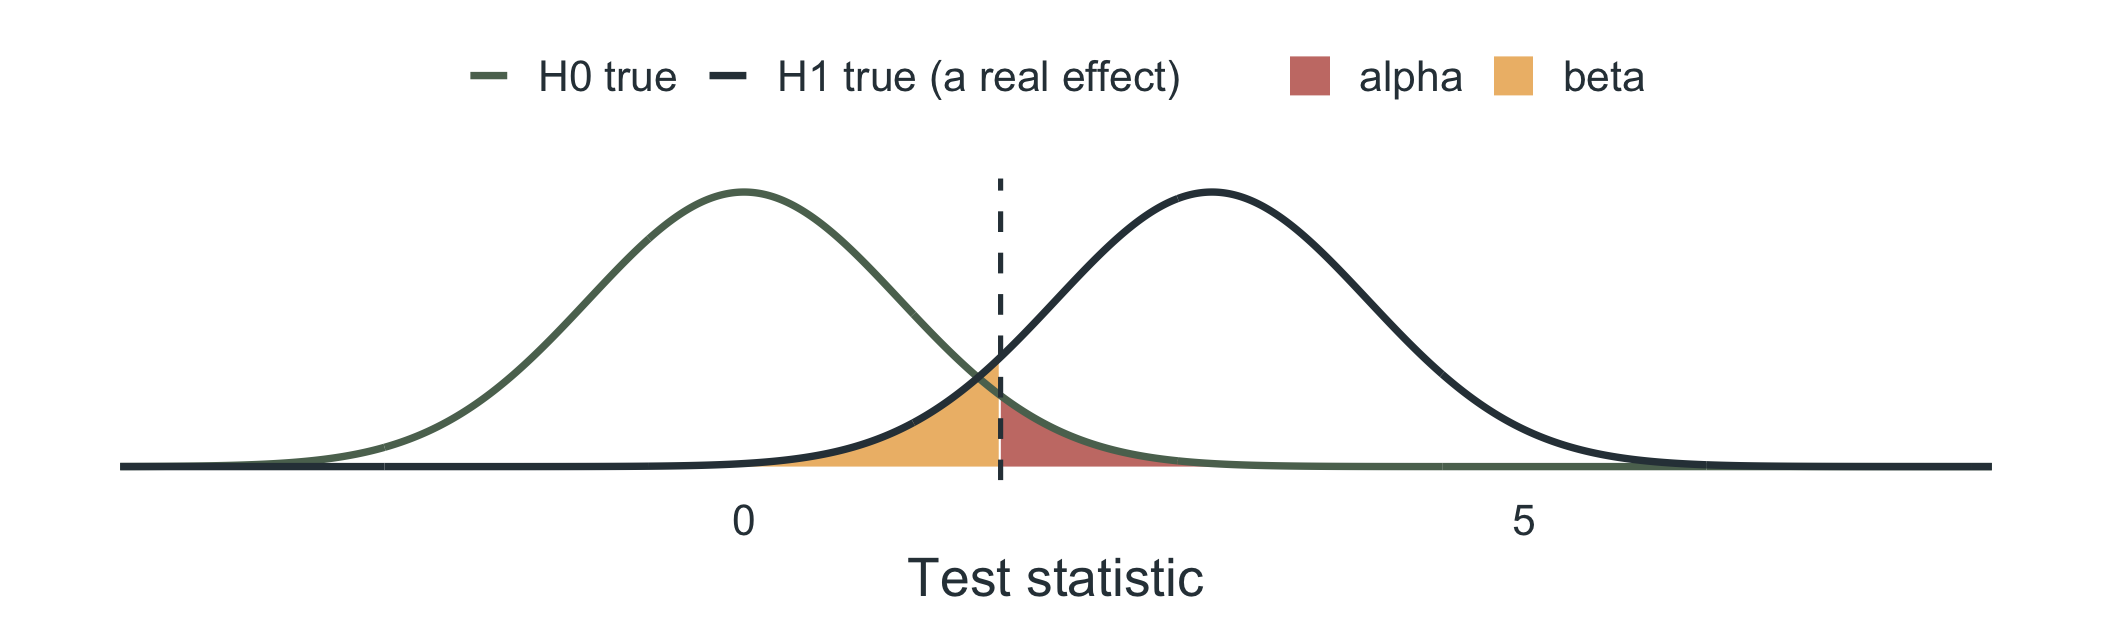
The dashed line is the critical value: beyond it we reject \(H_0\).
\(\alpha\) (red): a true null gets rejected (Type I error). \(\beta\) (orange): a real effect is missed (Type II error).
Power is \(1 - \beta\): the chance of detecting a real effect.
Why Compare Means?
We often want to test whether a sample mean differs from a known population mean.
The one-sample t-test helps determine if the sample mean is significantly different from the hypothesized population mean.
school
Exam scores
Class average vs. a national average of 75
timer
Reaction times
Average vs. a published 250 ms standard
linear_scale
Scale midpoints
Ratings vs. the scale midpoint
Why Not z?
From z to t
In lecture 8 we computed \(z = \dfrac{\bar{x} - \mu}{\sigma / \sqrt{n}}\), which needs the population standard deviation \(\sigma\).
In practice we almost never know \(\sigma\), so we substitute the sample’s \(s\).
But \(s\) changes from sample to sample, especially when \(n\) is small. That is extra uncertainty the normal curve does not account for.
So the sampling distribution has heavier tails than the normal curve: the t-distribution. A result must be more extreme to count as unusual.
Why Not z?
Same \(\alpha = .05\), bigger cutoff for small samples
Two-tailed critical values:
1.96
z (\(\sigma\) known)
2.09
t, \(df = 19\) (\(n = 20\))
2.78
t, \(df = 4\) (\(n = 5\))
- The smaller the sample, the more the t cutoff moves away from the z cutoff. With large \(n\), they are nearly identical.
The t-test
Three types, three cases
One-Sample
\(t=\dfrac{\bar{x}-\mu}{s/\sqrt{n}}\)
Paired-Samples
\(t=\dfrac{\bar{D}}{s_D/\sqrt{n}}\)
Independent-Samples
\(t = \dfrac{\bar{x}_1 - \bar{x}_2}{\sqrt{s_p^2\left(\frac{1}{n_1} + \frac{1}{n_2}\right)}}\)
\(s_p^2 = \dfrac{(n_1 - 1)s_1^2 + (n_2 - 1)s_2^2}{n_1 + n_2 - 2}\)
We use the sample SD (\(s\)) to estimate the standard error (\(s/\sqrt{n}\)), since \(\sigma\) is usually unknown. \(s_D\) is the SD of the difference scores and \(s_p^2\) is the pooled variance.
The critical value depends on the degrees of freedom: \(df = n - 1\) (one-sample, paired) or \(n_1 + n_2 - 2\) (independent).
The Sample SD, \(s\)
\[s = \sqrt{\dfrac{\sum (x_i - \bar{x})^2}{n-1}}\]
- Numerator: each score’s squared distance from the mean, added up
- Denominator: \(n-1\), then take the square root
- For \(s_D\), use each person’s difference score \(D\) in place of \(x\)
- We use \(s\) because \(\sigma\) is usually unknown (if \(\sigma\) were known, we would use \(\sigma/\sqrt{n}\) and a z-test instead)
The t-distribution
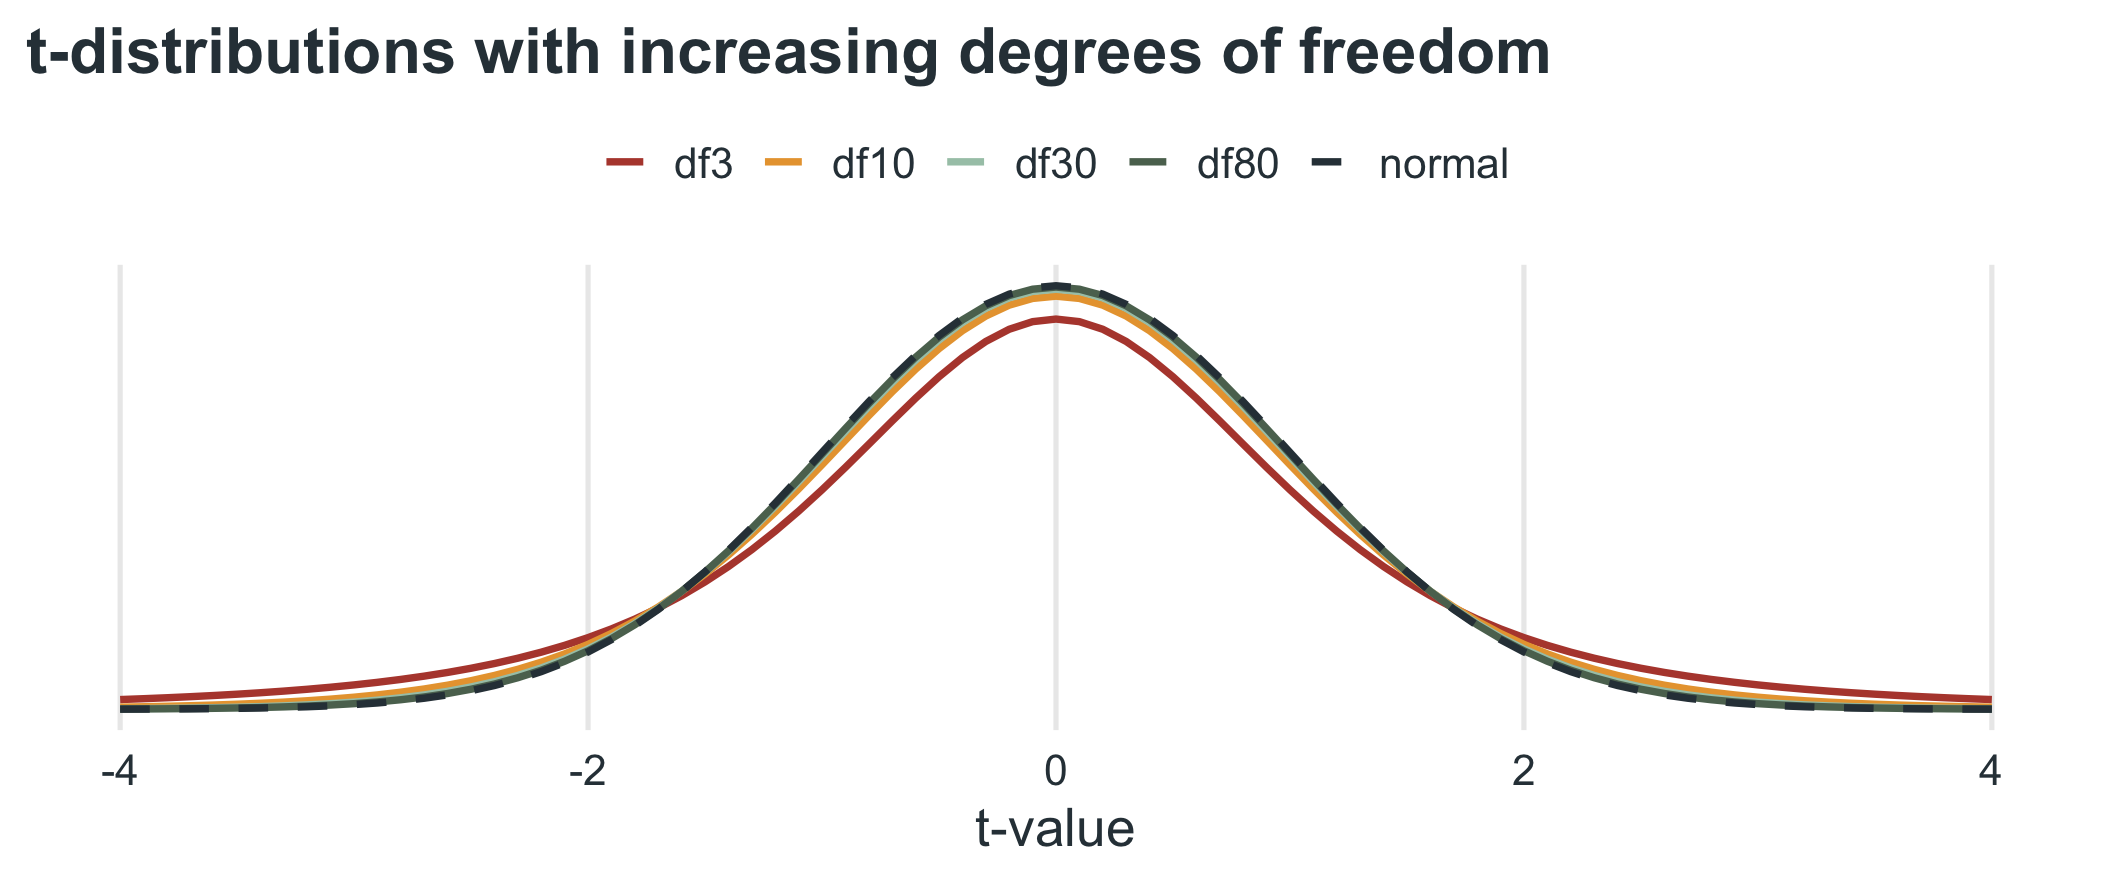
The t-distribution has heavier tails than the normal curve when df is small, because \(s\) is only an estimate of \(\sigma\).
As df grows, the t-distribution approaches the normal curve.
Assumptions of the One-Sample t-Test
Assumptions
- The data are continuous (interval or ratio scale).
- The sample is randomly selected.
- The data are normally distributed (or the sample size is large enough for the Central Limit Theorem to apply).
The One-Sample t-Test Formula
One-Sample t-Test
\(\large{t = \dfrac{\color{blue}{\bar{x}} - \mu}{\color{orange}{s}/\sqrt{n}}}\)
\(\color{blue}{\bar{x}}\) = sample mean
\(\mu\) = population mean (null hypothesis value)
\(\color{orange}{s}/\sqrt{n}\) = the standard error (SE), estimated from the sample: \(s\) is the sample SD and \(n\) the sample size
\(s = \sqrt{\dfrac{\sum (x_i - \bar{x})^2}{n-1}}\) = sum of squared deviations from the mean, divided by \(n-1\), then square-rooted
Hypothesis Testing Steps
Four steps
- Set hypotheses: define both the null and alternative.
- Collect sample data: use the appropriate sampling method and collect the needed data.
- Compute the t-statistic: conduct the correct t-test.
- Compare to the critical value: use the t-statistic, sample size (df), and alpha level to determine statistical significance. Equivalently, compare the p-value to \(\alpha\).
Reading the t-Table
Critical values by degrees of freedom
| df | One-tailed .05 (two-tailed .10) |
One-tailed .025 (two-tailed .05) |
One-tailed .005 (two-tailed .01) |
|---|---|---|---|
| 15 | 1.753 | 2.131 | 2.947 |
| 19 | 1.729 | 2.093 | 2.861 |
| 24 | 1.711 | 2.064 | 2.797 |
| 29 | 1.699 | 2.045 | 2.756 |
| ∞ (z) | 1.645 | 1.960 | 2.576 |
Find your df (\(n - 1\) for a one-sample test), then the column for your \(\alpha\) and tails. If \(|t|\) is beyond the critical value, reject \(H_0\) (here \(2.68 > 2.093\)).
In R:
qt(.975, df = 19)returns2.093(the upper 2.5% cutoff).
Hypothesis Testing Steps
Manual: hypotheses and data
20students have a mean exam score of78(SD =5). Does the class differ from the national average of75?
1. Set hypotheses
- \(H_0\): The average exam score is 75 (\(\mu = 75\)).
- \(H_A\): The average exam score is not 75 (\(\mu \neq 75\)).
2. Collect sample data
- \(n = 20\), \(\color{blue}{\bar{x}} = 78\), \(\color{orange}{s} = 5\)
Hypothesis Testing Steps
Manual: test and decide
3. Compute the t-statistic
\(t = \dfrac{78 - 75}{\frac{5}{\sqrt{20}}} = \dfrac{3}{1.118} = 2.68\)
4. Compare to the critical value
- At \(\alpha = .05\) (two-tailed) and \(df = 19\): \(t_{critical} = \pm 2.093\).
- Since \(2.68 > 2.093\), we reject \(H_0\).
Hypothesis Testing Steps
Programmatic
one_sample.R
    One Sample t-test

data:  dat
t = 2.6833, df = 19, p-value = 0.01471
alternative hypothesis: true mean is not equal to 75
95 percent confidence interval:
 75.65993 80.34007
sample estimates:
mean of x
       78
Hypothesis Testing Steps
Programmatic: by hand and the critical value
Reporting Results
APA-style
A one-sample t-test was conducted to compare exam scores to the national average of
75. Results showed a significant difference,t(19) = 2.68, p = .015, indicating that students scored significantly higher than the national average (M = 78, SD = 5).
- What kind of test?
- What is being compared?
- Is it significant?
- What are the test results?
Reporting Results
APA-style
A one-sample t-test was conducted to compare exam scores to the national average of
75. Results showed a significant difference,t(19) = 2.68, p = .015, indicating that students scored significantly higher than the national average (M = 78, SD = 5).
- What kind of test? one-sample t-test
- What is being compared? exam scores to the national average
- Is it significant? significant difference
- What are the test results?
t(19) = 2.68, p = .015
Interpreting Results
Sample summary table
A significant result (\(p < .05\)) suggests that the sample mean is different from the population mean.
A non-significant result (\(p > .05\)) means we fail to reject \(H_0\) (insufficient evidence of a difference).
| M | t | p | df | conf.low | conf.high | alternative | |
|---|---|---|---|---|---|---|---|
| One Sample t-test | 78 | 2.683 | 0.015 | 19 | 75.66 | 80.34 | two.sided |
Visualizing Data
Scores against the national average
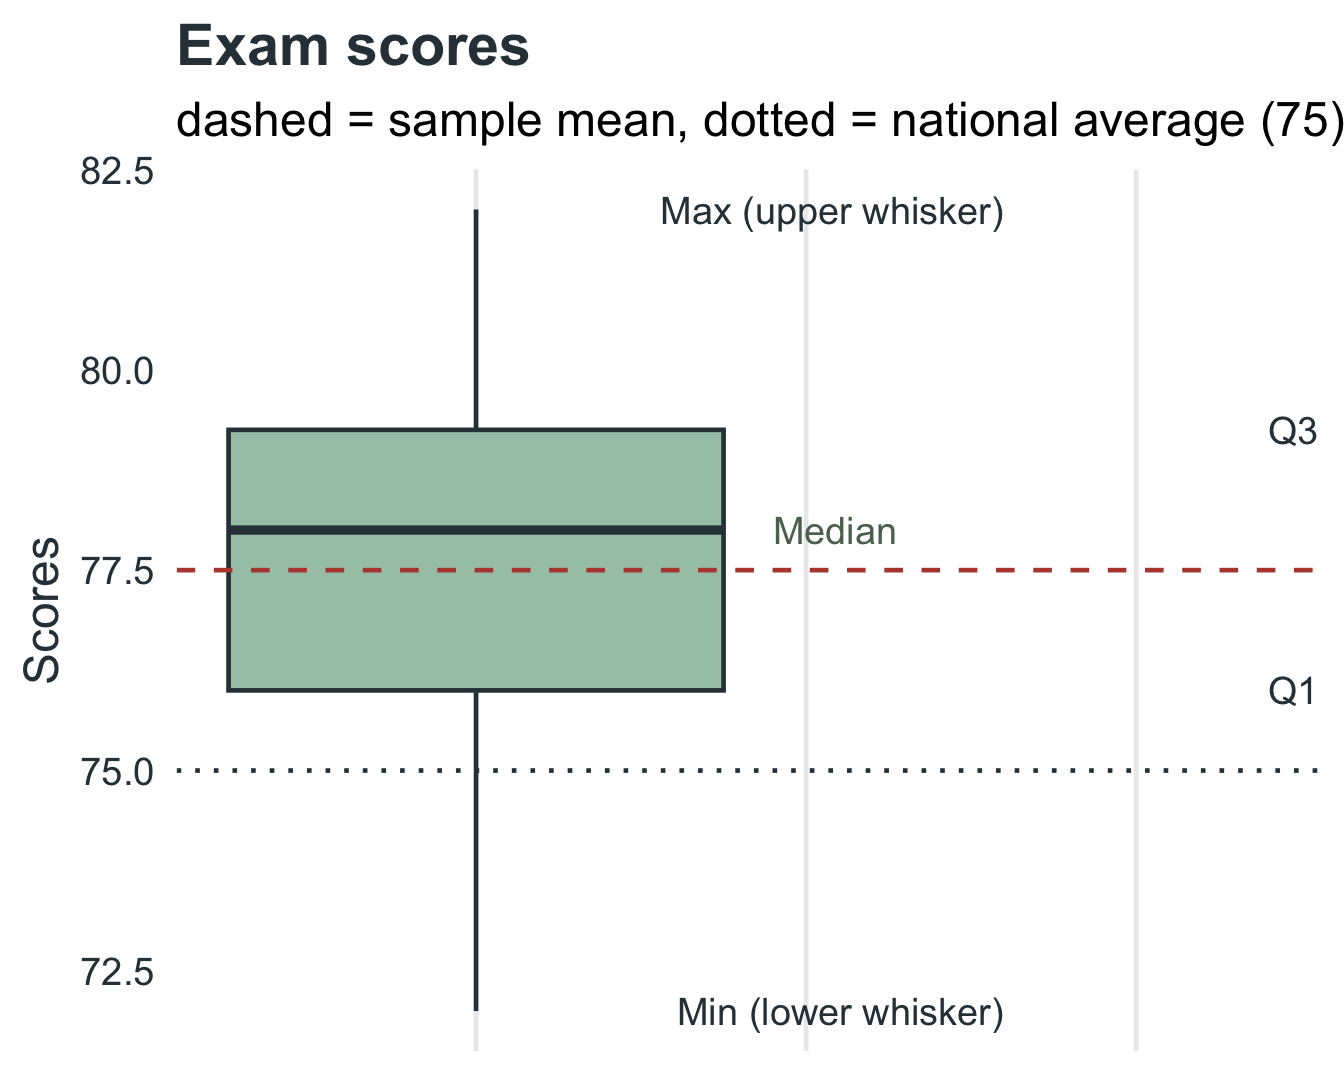
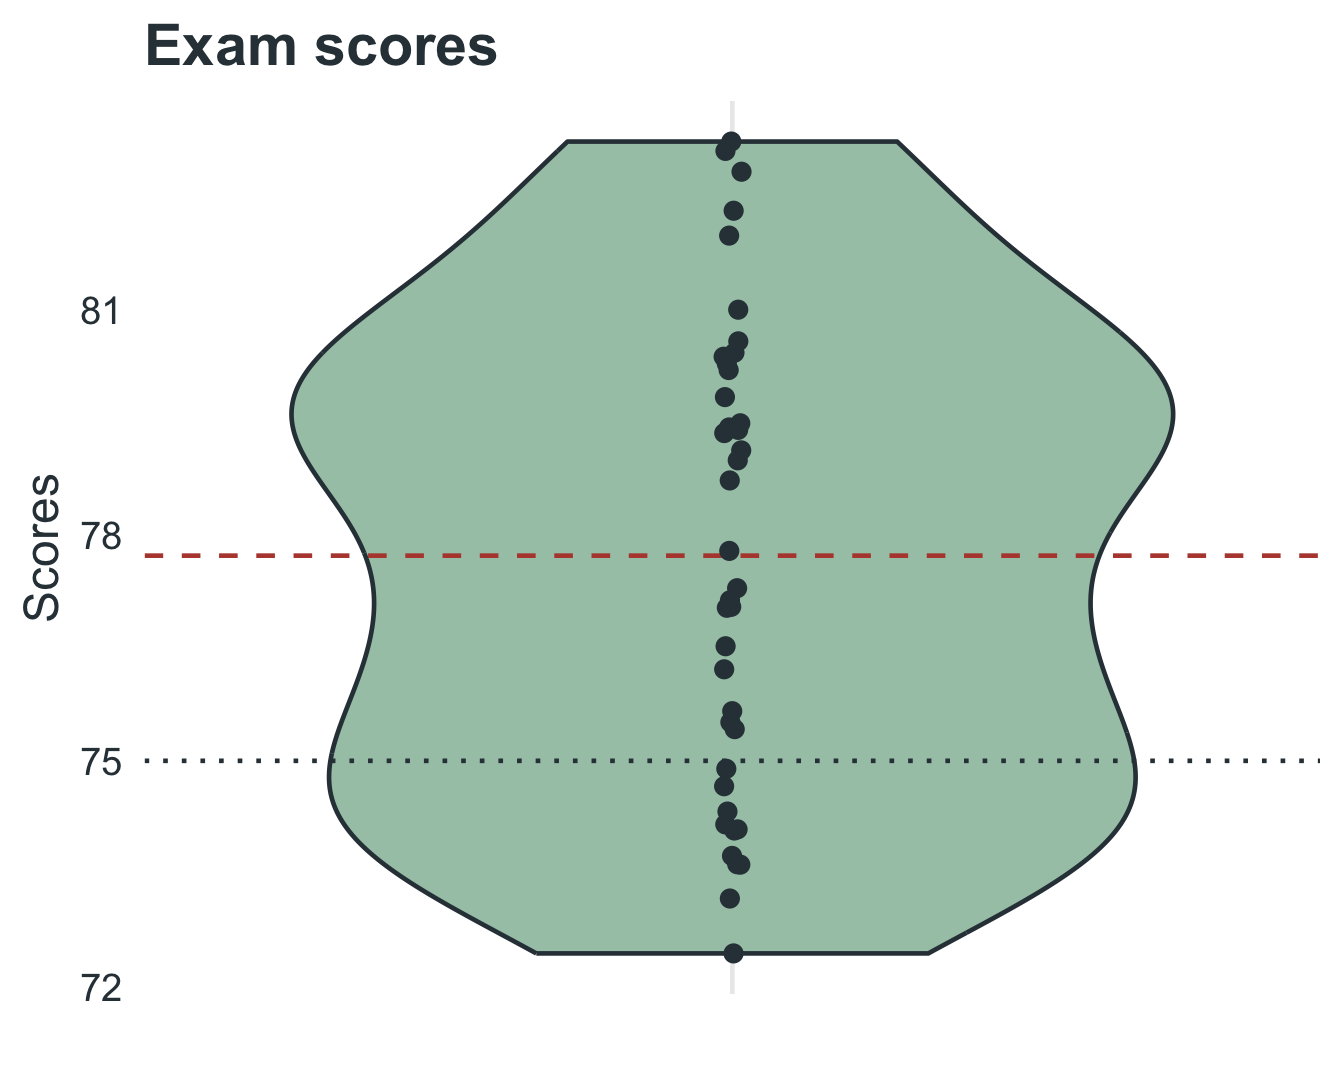
Exam Scores vs. National Average
Hypotheses
A professor wants to test if students in their class scored differently from the national average of
75on an exam. A sample of25students has a mean score of78with a standard deviation of10.
Null Hypothesis (\(H_0\)): \(\mu = 75\) (no difference)
Alternative Hypothesis (\(H_A\)): \(\mu \neq 75\) (scores differ)
Exam Scores vs. National Average
Manual
Compute t
\(t = \dfrac{\color{blue}{\bar{x}} - \mu}{\frac{\color{orange}{s}}{\sqrt{n}}} = \dfrac{78 - 75}{\frac{10}{\sqrt{25}}} = \dfrac{3}{2} = 1.5\)
Decide
For \(df = 24\) (\(25 - 1\)), the critical value at \(\alpha = .05\) (two-tailed) is \(\pm 2.064\). Since \(|t| = 1.5 < 2.064\), we fail to reject \(H_0\).
Exam Scores vs. National Average
Programmatic
exam_scores.R
    One Sample t-test

data:  x
t = 1.5, df = 24, p-value = 0.1467
alternative hypothesis: true mean is not equal to 75
95 percent confidence interval:
 73.8722 82.1278
sample estimates:
mean of x
       78
APA Reporting
A one-sample t-test was conducted to determine whether students’ exam scores differed from the national average (\(\mu\) = 75). Results were not statistically significant,
t(24) = 1.50, p = .147, indicating that students performed similarly to the national average (M = 78, SD = 10).
Daily Coffee Consumption
Hypotheses
A coffee company claims that people drink an average of
3 cupsof coffee per day. A researcher samples16 individuals, finding a mean of2.5 cupsand a standard deviation of1 cup.
Null Hypothesis (\(H_0\)): \(\mu = 3\)
Alternative Hypothesis (\(H_A\)): \(\mu < 3\) (people drink less)
Daily Coffee Consumption
Manual
Compute t
\(t = \dfrac{2.5 - 3}{1 / \sqrt{16}} = \dfrac{-0.5}{0.25} = -2.0\)
Decide
For \(df = 15\) (\(16 - 1\)), the critical t-value for a one-tailed test at \(\alpha = .05\) is \(-1.753\). Since \(-2.0 < -1.753\), we reject \(H_0\).
Daily Coffee Consumption
Programmatic
coffee.R
    One Sample t-test

data:  x
t = -2, df = 15, p-value = 0.03197
alternative hypothesis: true mean is less than 3
95 percent confidence interval:
     -Inf 2.938263
sample estimates:
mean of x
      2.5
APA Reporting
A one-sample t-test was conducted to test whether daily coffee consumption was lower than the reported average of
3 cups. Results showed a significant difference,t(15) = -2.00, p = .032(one-tailed), suggesting that people consume significantly fewer cups of coffee per day than reported (M = 2.5, SD = 1).
Sleep Duration Among College Students
Hypotheses
A health researcher believes college students sleep less than
7 hoursper night. A sample of30 studentsreports a mean of6.5hours with a standard deviation of1.2hours.
Null Hypothesis (\(H_0\)): \(\mu = 7\)
Alternative Hypothesis (\(H_A\)): \(\mu < 7\)
Sleep Duration Among College Students
Manual
Compute t
\(t = \dfrac{6.5 - 7}{1.2 / \sqrt{30}} = \dfrac{-0.5}{0.219} = -2.28\)
Decide
For \(df = 29\), the critical t-value for a one-tailed test at \(\alpha = .05\) is \(-1.699\). Since \(-2.28 < -1.699\), we reject \(H_0\).
Sleep Duration Among College Students
Programmatic
sleep.R
    One Sample t-test

data:  x
t = -2.2822, df = 29, p-value = 0.015
alternative hypothesis: true mean is less than 7
95 percent confidence interval:
    -Inf 6.87226
sample estimates:
mean of x
      6.5
APA Reporting
A one-sample t-test was conducted to test whether college students sleep fewer than 7 hours per night. Results were statistically significant,
t(29) = -2.28, p = .015(one-tailed), indicating that students get significantly less sleep than the recommended amount (M = 6.5, SD = 1.2).
One-Sample T-Test | ⬡⬢⬡⬢⬡⬢