Sampling Theory
Lecture 9
Dave Brocker
Farmingdale State College
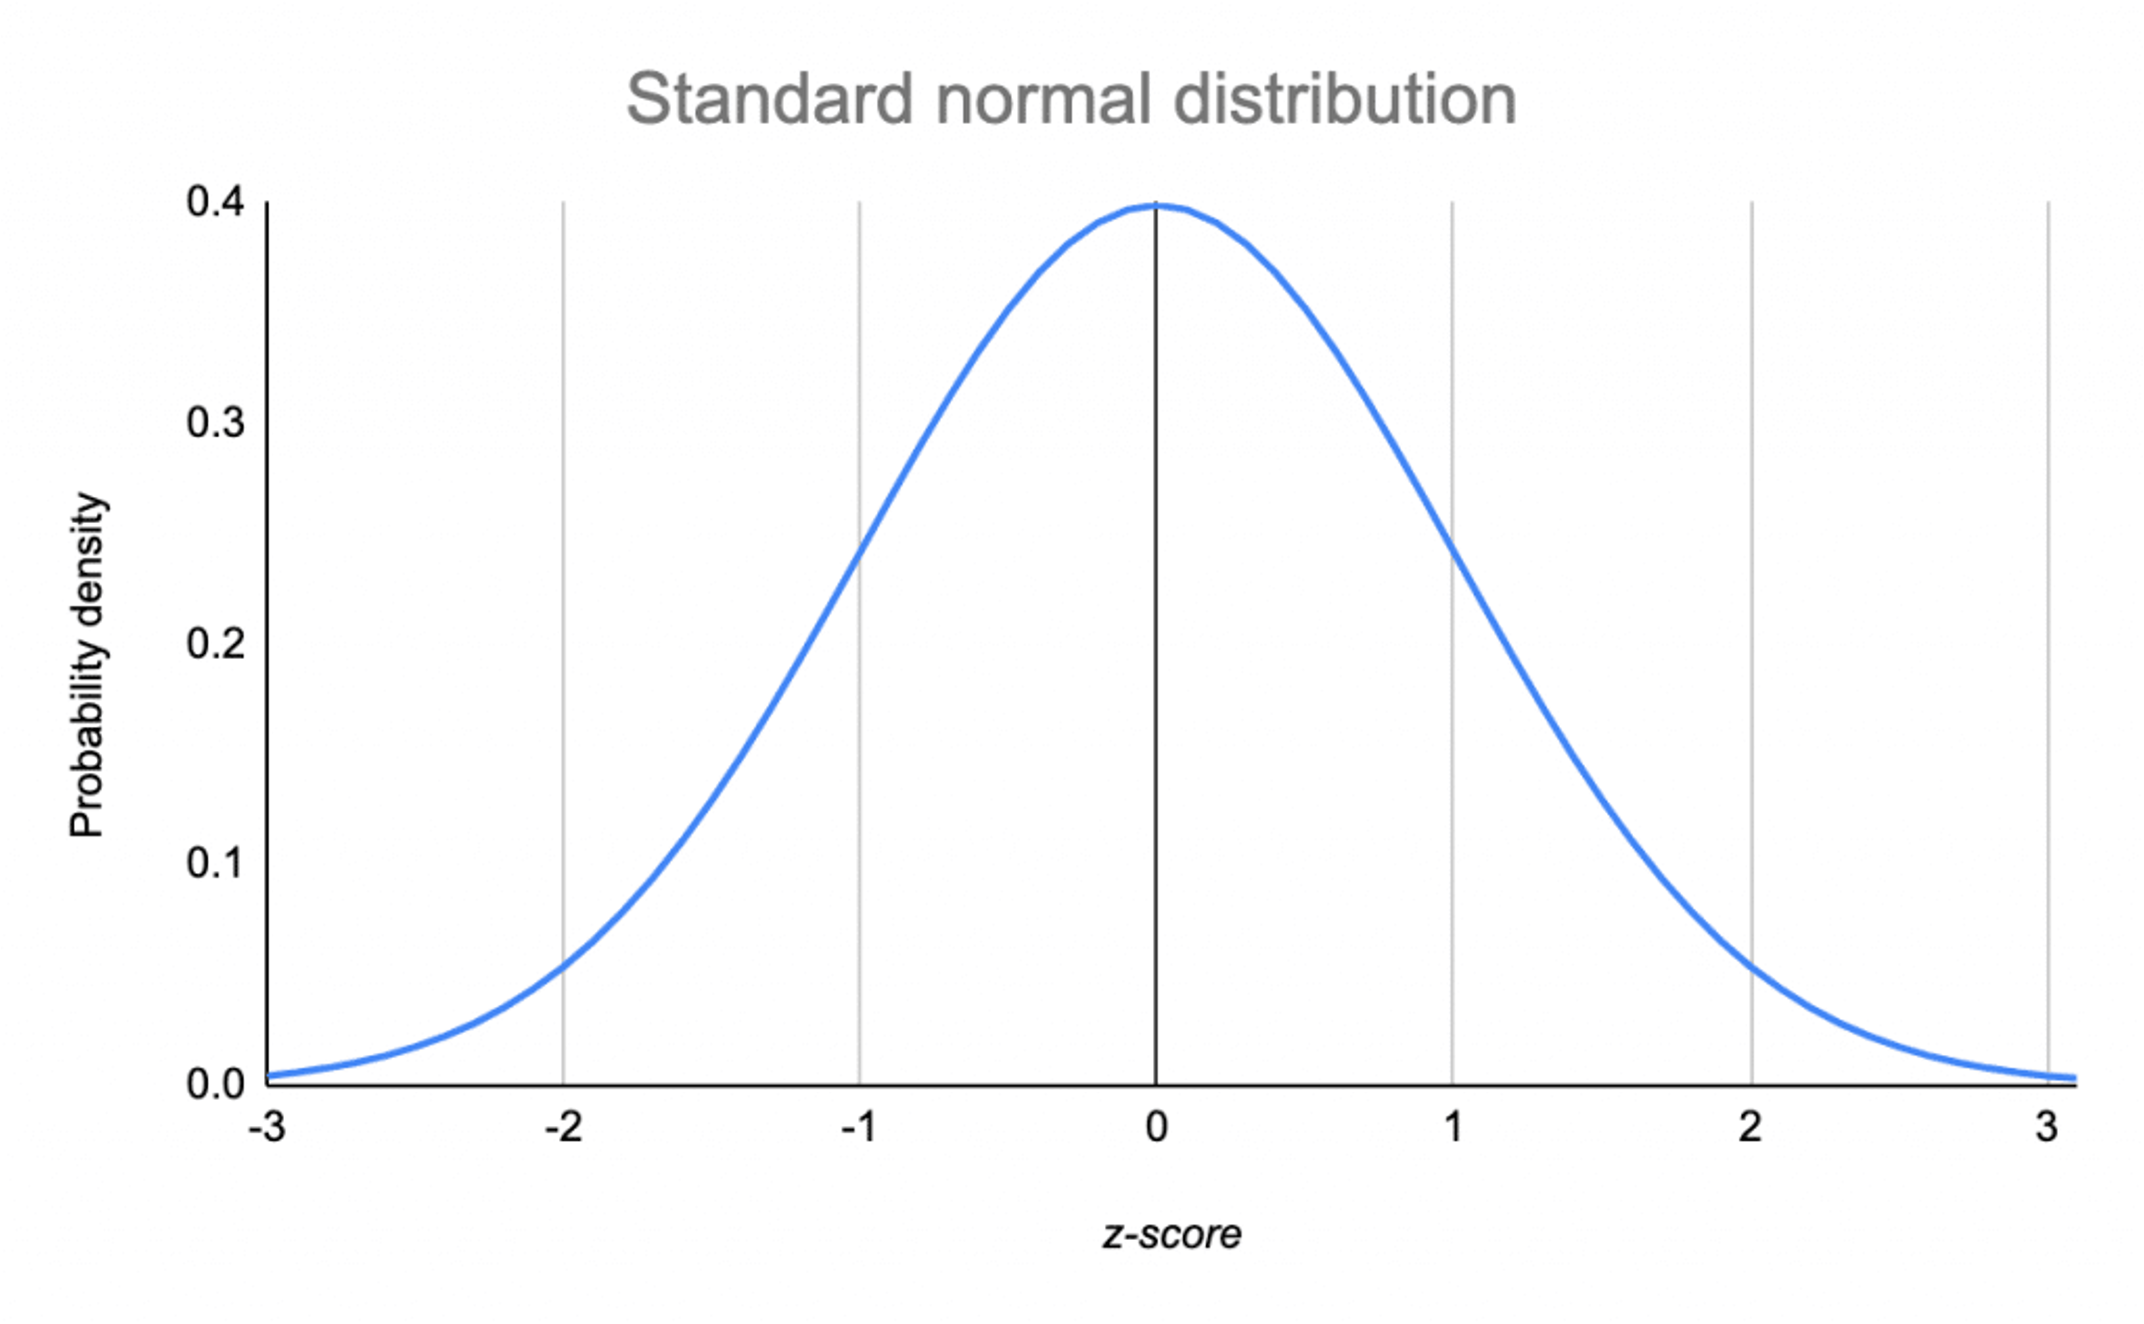
Standard Normal Distribution
The 4 properties of a standard normal distribution are:
![]()
Statistics
Descriptive Statistics:
Inferential Statistics:
Sampling theory
Professor Brocker still wants to know how much adults in the US enjoy the Netflix Original, Dark. He has unlimited funds to study this very important research question. He hires his 24 students from to collect the data. Each student has to collect 500 responses to the following question:
Sampling theory
On a scale of 1 (I hate it with my entire being) to 10 (I believe in my soul that Dark is the best show ever made), how much do you enjoy Dark?
![]()
Sampling Theory
How many people did each of you ask?
| S1 | S2 | S3 | S4 | S5 | S6 | S7 | S8 | S9 | S10 | S11 | S12 | S13 | S14 | S15 | S16 | S17 | S18 | S19 | S20 | S21 | S22 | S23 | S24 | S25 | S26 | S27 | S28 | S29 | S30 |
| 7 | 3 | 4 | 1 | 4 | 7 | 2 | 6 | 7 | 4 | 2 | 4 | 2 | 5 | 5 | 2 | 3 | 7 | 6 | 4 | 5 | 6 | 7 | 4 | 3 | 7 | 2 | 3 | 1 | 1 |
| 6 | 5 | 2 | 1 | 3 | 3 | 5 | 6 | 3 | 6 | 4 | 3 | 4 | 3 | 5 | 7 | 7 | 7 | 5 | 5 | 2 | 7 | 1 | 4 | 3 | 4 | 7 | 5 | 1 | 5 |
| 7 | 2 | 2 | 5 | 4 | 5 | 6 | 6 | 4 | 7 | 3 | 5 | 3 | 4 | 7 | 4 | 6 | 7 | 7 | 1 | 1 | 1 | 2 | 6 | 4 | 2 | 1 | 3 | 3 | 7 |
| 4 | 1 | 2 | 5 | 3 | 1 | 2 | 5 | 7 | 3 | 5 | 5 | 2 | 3 | 3 | 7 | 4 | 2 | 5 | 1 | 4 | 7 | 1 | 1 | 5 | 5 | 1 | 4 | 4 | 4 |
| 4 | 6 | 3 | 6 | 7 | 1 | 6 | 6 | 3 | 7 | 4 | 1 | 7 | 6 | 3 | 1 | 6 | 1 | 4 | 7 | 2 | 7 | 2 | 5 | 7 | 6 | 4 | 3 | 6 | 3 |
| 5 | 5 | 3 | 5 | 3 | 7 | 1 | 4 | 4 | 7 | 2 | 5 | 7 | 7 | 3 | 6 | 6 | 5 | 4 | 4 | 4 | 7 | 1 | 6 | 6 | 1 | 7 | 3 | 7 | 2 |
Sampling theory
- Once each of you collect 500 responses, I ask you to calculate the average answer. So you calculate the mean (you add up all 500 responses, and then divide that number by 500).
\[\frac{\sum(x_1...x_{500}}{500}\]
Sampling theory
![]()
Sampling theory
We can do lots of cool things with Sample Means. We could calculate the Mean of the Sample Means. We could calculate the standard deviation of the Sample Means.
But…it’s theoretical. It doesn’t really exist, but we imagine it’s existence for the sake of Sampling Theory.
Sampling distribution
A Sampling Distribution is the theoretical distribution of means across every single possible sample.
Like all the Dark samples.
If we took samples of the population until we got every single person in the population, then calculated the mean for each sample, they would distribute like this:
![]()
Sampling theory
Except now each value in this distribution no longer represents 1 person/participant.
Each value in this distribution represents the average of 1 sample, a Sample Mean.
![]()
What does the Stats Cat say?
![]()
Sampling theory
Except now each value in this distribution no longer represents 1 person/participant.
Each value in this distribution represents the average of 1 sample, a Sample Mean.
![]()
Review
What is a sample distribution?
What does each X value in a sample distribution represent?
What does \(\mu\) represent?
What does \(\sigma\) represent?
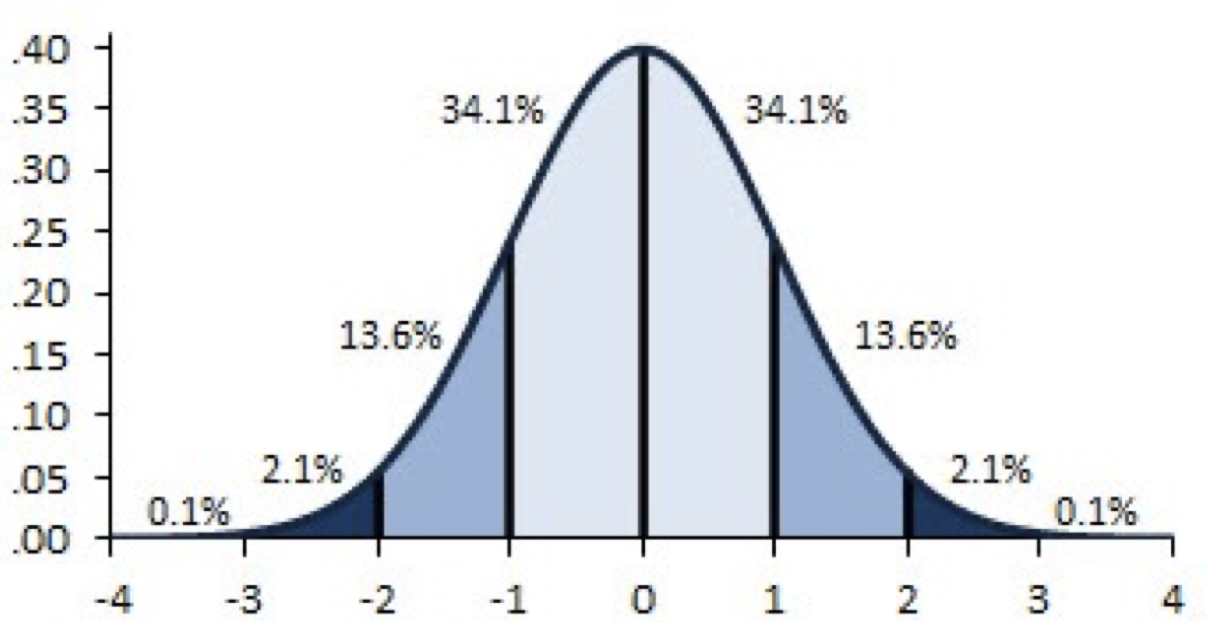
Probability
- What percentage of participants rated Dark with a z-score of 2 or HIGHER?
![]()
Probability
![]()
THIS IS the key point
We assume that the distribution of sample means is normal.
We use that assumption to gauge the probability of getting a particular mean from a single sample.
We can literally find that probability, the same way we did with x-values in a normal distribution.
Example
We want to know how much people like pizza.
There are 12,500 people in our population. Each of the 25 of us collects a sample of 500.
\(500 \times 25 = 12,500\)
Each of us calculates the mean response from our sample of 500 people.
We plot those means and it gives us a normal distribution.
What do we call those means?
Pizza Plot
Visual Example
![]()
Example
I randomly choose a mean from our distribution of sample means, about how much people like pizza.
What is the probability of picking a mean with a z-score of -1 or less?
![]()
Sampling theory
Sampling Theory is the body of principles underlying the drawing of infinite samples that accurately represent the population from which they are taken and to which inferences can be made.
Sampling theory as the basis for inferential statistics
Independent variable:
- Experimental Group: Super secret limitless drug
Control Group: Placebo
Sampling theory
Sampling Theory is the idea that if we took infinite samples of a population, they would create a normal distribution.
And because they’d create a normal distribution, we can make guesses about the probability of getting a specific mean.
We will use this probability to gauge significance of our inferential statistics.
Sampling theory
The dispersion of a sample is known as the standard deviation, or SD, or sometimes just s.
The dispersion of a population cannot be a “deviation” because we don’t actually know it. So instead, we call it the Standard Error, or SE, or most often (sigma).
Sampling theory, but candy
- This is a jar of 600 pieces of candy.
![]()
If I took scoops of 25 pieces of candy at a time, on average how many oranges would I get per scoop?
I have a scoop of 25 pieces of candy, and 6 of them are orange.
Sampling theory, but candy
[Insert two peaks with MM]
Did this scoop come from the jar of m&ms?
I have a scoop of 25 pieces of candy, and all 25 of them are orange.
Did this scoop come from the jar of m&ms?
P-values
### Hypothesis testing, Pt 1
Sampling theory
We ask every single FSC student to rate their sense of belonging on FSC campus on a scale of 1 (I don’t belong at all) to 10 (I belong completely).
We each calculate the average response from our own sample of 400.
There are about 10,000 students at Farmingdale State College.
Each of the 25 of us recruits a sample of 400 students.
Sampling theory
![]()
Sampling theory
Now we have 25 samples of 400 FSC students each, which equals the full student population of 10,000.
We take 25 samples of 400 students each from another college…John Jacob Jinglehymer Smith University. JJJSMU also has 10,000 students.
We ask the JJJSMU students the same question about sense of belonging.
We find the mean of each of the 25 samples from JJJSMU
Sampling Theory as The Basis for Inferential Statistics
What is a hypothesis?
A hypothesis is a testable prediction of what will happen in our experiment that:
Hypothesis:
Example
Professor Brocker wants to know if Millennials enjoy the Netflix Original, Dark significantly more than Gen Z. She recruits 500 Millennials and 500 Zoomers and asks them to rate Dark on a scale of 1 to 10 (10 being fantastic).
- Hypothesis: Millennials will rate their enjoyment of Dark as significantly higher than their Gen Z peers.
Hypothesis:
Example
- Hypothesis: Millennials will rate their enjoyment of Dark as significantly higher than their Gen Z peers.
What is a Hypothesis?
An Alternative Hypothesis is a testable prediction of what will happen in our experiment that:
Alternative hypothesis
An Alternative Hypothesis is a testable prediction of what will happen in our experiment that names of the variables (independent and dependent) and clearly contrasts the groups.
- The Alternative Hypothesis is written as \(H_1\)
Null Hypothesis
The Null Hypothesis states that nothing will happen. \(H_0\)
Because Null means zero, nothing, nada.
The Null Hypothesis states that nothing will happen while also:
- Naming of the variables (independent and dependent)
Alternative & Null Hypotheses:
Example
Professor Brocker’s Dark Experiment:
Alternative Hypothesis: Millennials will rate their enjoyment of Dark as significantly higher than their Gen Z peers.
Null Hypothesis: Millennials and Gen Z will not differ in their rating of enjoyment of the Eric Andre Show.
Hypothesis Testing
Example 1
Dr. Apriceno wants to know if giving her students coffee will improve their exam scores. She randomly assigns 13 of her 26 students to drink a doubleshot; she calls this the experimental group. The other 13 students drink decaf (a placebo); she calls this the control group.
\(H_0\):
\(H_1\):
Hypothesis Testing
Example 2
Esmeralda gives an anti-depressant to 100 individuals suffering from depression. She gives another 100 individuals a placebo. After 2 months, we measure their depression.
\(H_0\):
\(H_1\):
Hypothesis Testing
Practice
Jonas assigns half of the participants to engage in aerobic exercise for one hour a day 5 days a week for 6 months. The other half of the participants do not exercise for 6 months. At the end of the 6 months, Jonas measures the participants’ working memory capacity.
\(H_0\):
\(H_1\):
[Make big text] ## Better to be a reject than a failure
Rejects and Failures
In science, we do not say that we proved anything.
Nothing is ever really proven.
Our findings will be stated in terms of the Null Hypothesis.
The Null Hypothesis is that there are no differences between the groups.
Hypothesis testing practice
Jonas assigns half of the participants to engage in aerobic exercise for one hour a day 5 days a week for 6 months. The other half of the participants do not exercise for 6 months. At the end of the 6 months, Jonas measures the participants’ working memory capacity.
\(H_0\): There are no differences in working memory capacity between the experimental and control groups.
Rejects and Failures
In science, we do not say that we proved anything.
Our findings will be stated in terms of the Null Hypothesis.
If there are significant differences between the groups, we Reject the \(H_0\).
If there are NO differences between the groups, we Fail to Reject the \(H_0\).
Hypothesis testing
[Include YODA picture or something similar]
Hypothesis Testing
When reporting your findings, you must state them in terms of the Null Hypothesis. We do not mention the Alternative Hypothesis.
If the groups differ, we reject the null hypothesis: Reject \(H_0\).
If the groups do NOT differ, we fail: Fail to Reject \(H_0\)
Practice
Jonas assigns half of the participants to engage in aerobic exercise for one hour a day 5 days a week for 6 months. The other half of the participants do not exercise for 6 months. At the end of the 6 months, Jonas measures the participants’ working memory capacity. His test is not significant.
- State Claudio’s findings in terms of the null hypothesis:
Hypothesis Practice
Practice
Brendan assigns half of the participants to view a picture of a face on a mortuary table (control condition). The other half of the participants view an image of their own face made to look old using an aging filter (experimental condition). Pedro then measures all participants’ anxiety about dying and runs a t-test, which is statistically significant.
State Brendan’s findings in terms of the null hypothesis: