Introduction to Statistical Software
Lecture 7
Farmingdale State College
Statistical Software
Excel, R, SPSS, Jamovi, JASP – Oh My!
There are several tools you can use for statistical analyses.
PSY 360 (Research Methods) typically employs the use of both Excel and SPSS
I think the best approach is to use these options in addition to free software such as R.
Statistical Software
Excel, R, SPSS, Jamovi, JASP – Oh My!
R is available on all Operating Systems completely free of charge and can even be accessed through web browsers such as Safari, Chrome, or Mozilla Firefox.
- As an added bonus, R is even accessible in this presentation! Press ~ to see
Statistical Software
Why should I care?
Your time is worth something and if I can show you a different way of approaching statistical questions that you might find easier—I will do whatever I can to do so!
Your future job might not have SPSS
You can learn programming syntax and troubleshoot in real-time
Statistical Software
Excel
We have used Microsoft Excel in this course to demonstrate core concepts such as finding the arithmetic average, standard deviation, measures of central tendency, and calculating z-scores.
- Since statistical tests are mathematical at a base-level, (most) any test can be run in Excel that can be run elsewhere
Statistical Software
Excel
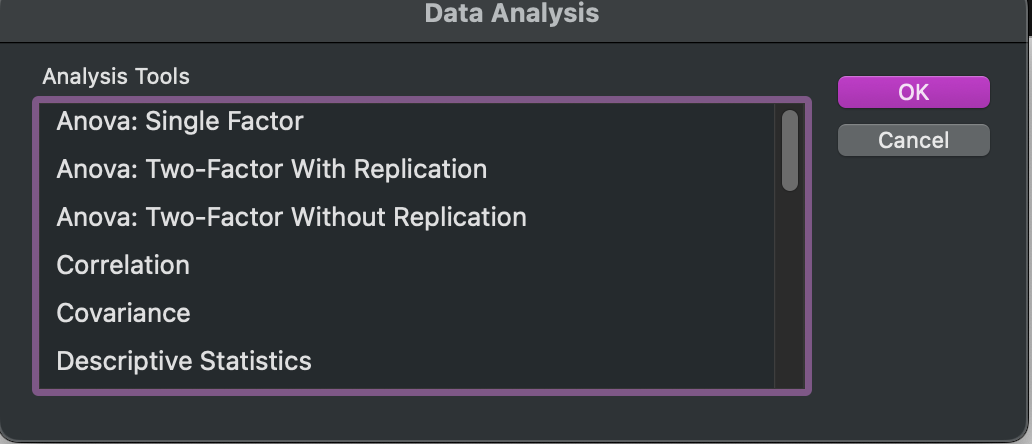
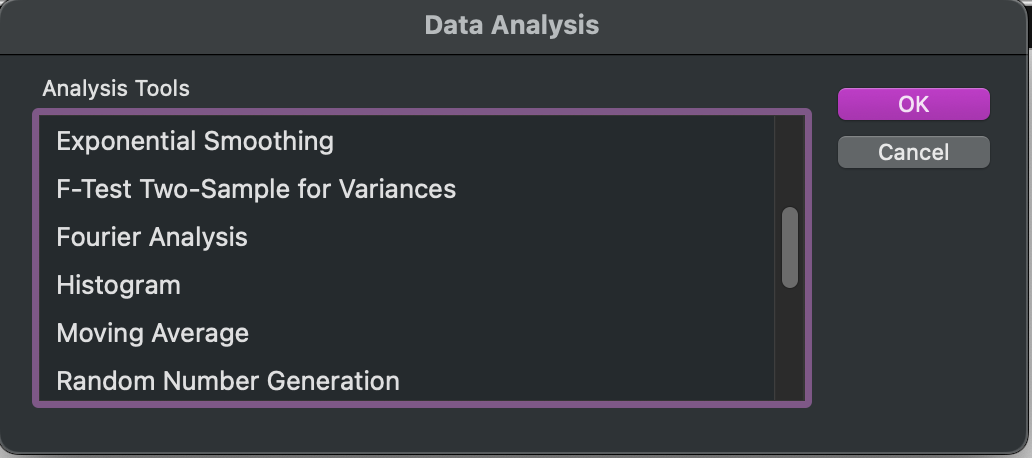
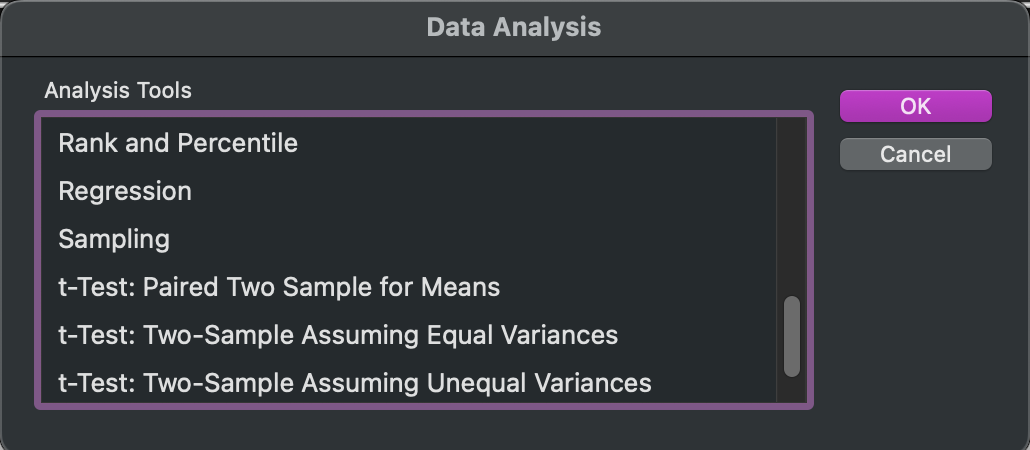
- Excel has dedicated first-party addons such as
Data Analysis Toolpakand third-party addons as well. TheData Analysis Toolpakcan be used to run the following tests:
Statistical Software
Excel
Statistical Software
Excel
Statistical Software
Excel
Statistical Software
Excel
Whoa! Those are a lot of tests! Excel is an absolute powerhouse, but some of the tests and options are somewhat difficult to access and/or have a steep learning curve.
Statistical Software
SPSS
SPSS (Statistical Principles for Social Science) is used in a variety of disciplines and has options for the majority of tests that you will end up running in your academic career. SPSS also has a syntax editor which allows you to have more control over your data/tests/outputs.
Statistical Software
SPSS: Example
Let’s walk through an example in SPSS step-by-step.
Open up the dataset
move_dat_reduced.csvfrom BrightspaceDouble-click on IBM SPSS and wait for the file to open
SPSS: Example
Descriptive Statistics
SPSS does its best to analyze your data and assign data value types (continuous, nominal) as well as scales of measurement (nominal, ordinal, interval, ratio).
SPSS will only allow specific data types to be analyzed in specific ways
SPSS does not always ‘know’ what you are looking for, so you need to make sure your data is set up correctly!
SPSS: Example
Descriptive Statistics
SPSS has two views, Variable View and Data View
Variable View: Provides an overview of your variables.
What is the name?
What is the data type?
What is the range of values?
Are there any labels?
What is the Measure type?
SPSS: Example
Descriptive Statistics
SPSS has two views, Variable View and Data View
Data View: Provides a glimpse of your raw data
What is in the first column?
What is in the second column?
etc.
SPSS: Example
Descriptive Statistics
Descriptive Statistics describe the data, they give us an idea of where our data (likely) comes from, the measures of central tendency, and estimation about normality can be made.
Mean | Sum
Standard Deviation
Range
Mode
Kurtosis*
Skewness*
SPSS: Example
Frequency Statistics
Frequency Statistics give us an idea of the composition of our dataset and allow us to make estimations and guesses in relation to the normality of our data
Frequency of Responses (% or n)
Minimum Values
Max Values
Range
SPSS: Example
Descriptive and Frequency Statistics
In our dataset, we want to investigate the categorical composition of our data as well as the statistical makeup of our data.
For the dataset provided, find the descriptive Statistics and Frequency Statistics for each variable of the appropriate data type.
⬡⬢⬡⬢⬡⬢⬡