Z-Scores and Probability Under the Normal Curve

PSY 348: Lecture 6

Dave Brocker

Farmingdale State College

Review

Proportional Breakdown

68.3%

of scores fall within 1 SD of the mean

95.4%

of scores fall within 2 SD of the mean

99.7%

of scores fall within 3 SD of the mean

Review

What’s a z-score again?

Z-Score
How many standard deviations a single score (an \(x\)) sits above or below the mean.

Z-scores

Why do we care?

Z-scores re-express the original data points (the \(x\)’s) so we can see, at a glance:

  • How close that \(x\) is to the mean
  • Where it falls in the spread of the distribution
  • How similar this participant is to the rest of the sample
  • How different this participant is from the majority of the sample

Z-scores

Why do we care?

Z-scores

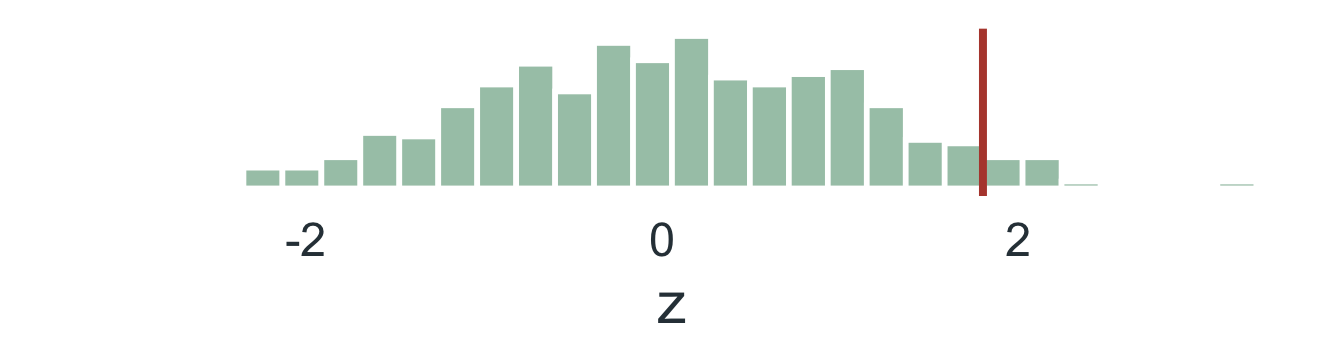
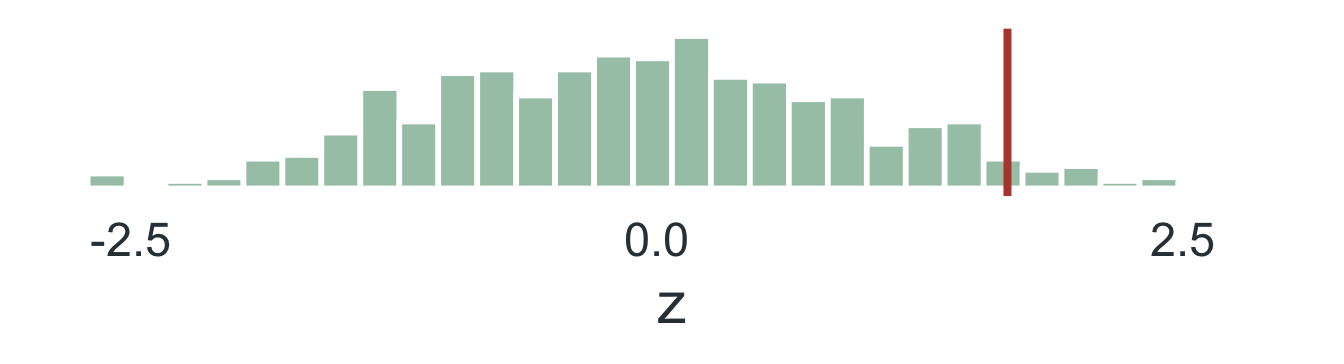
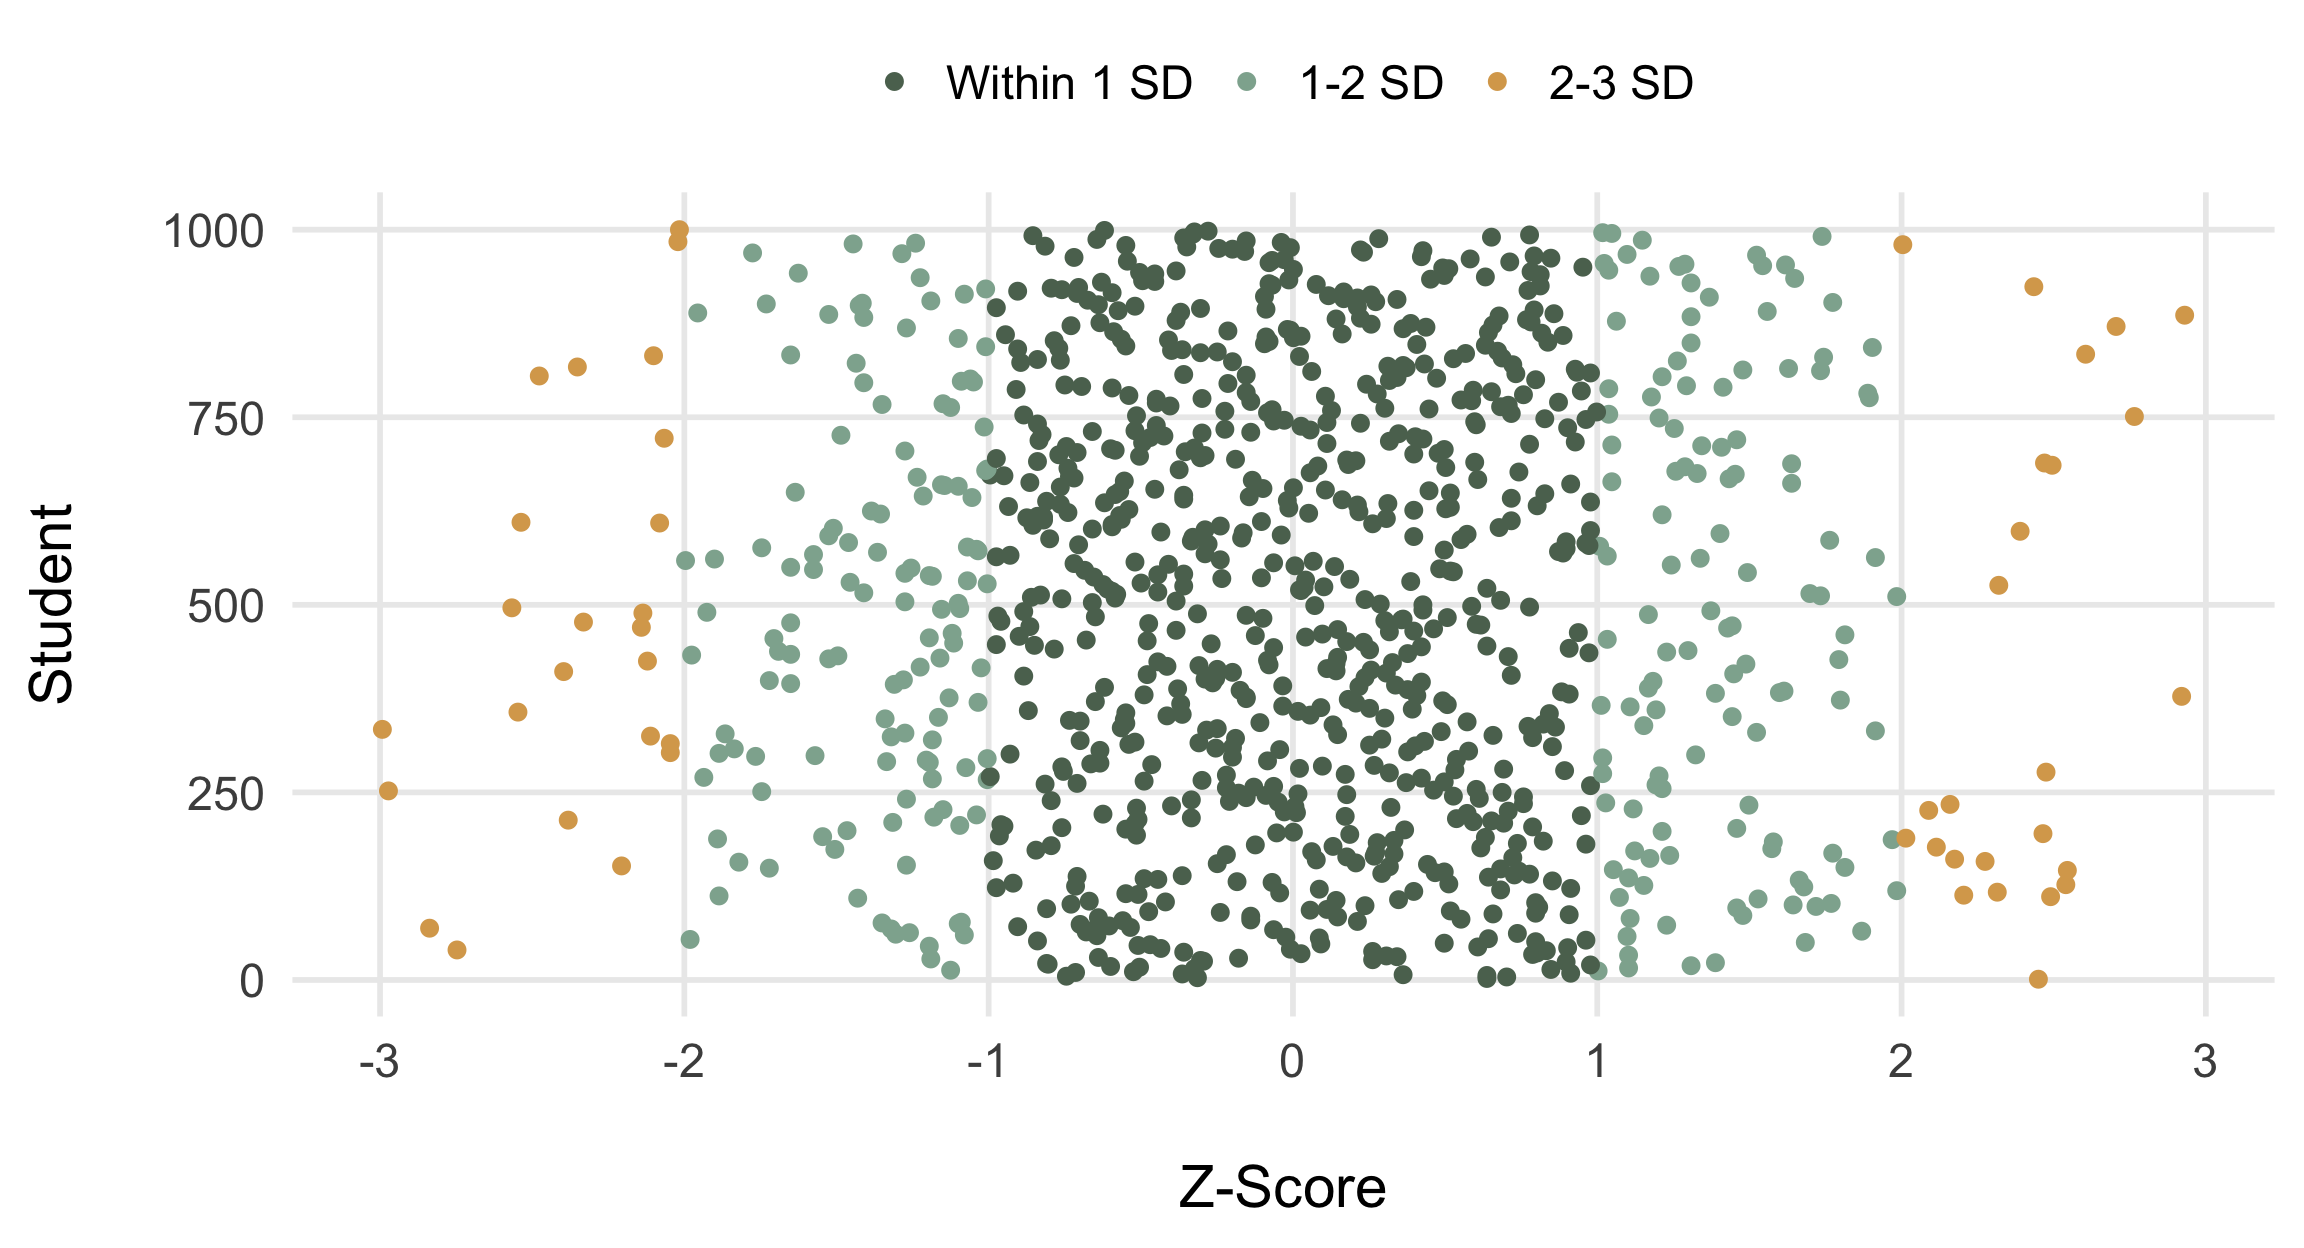
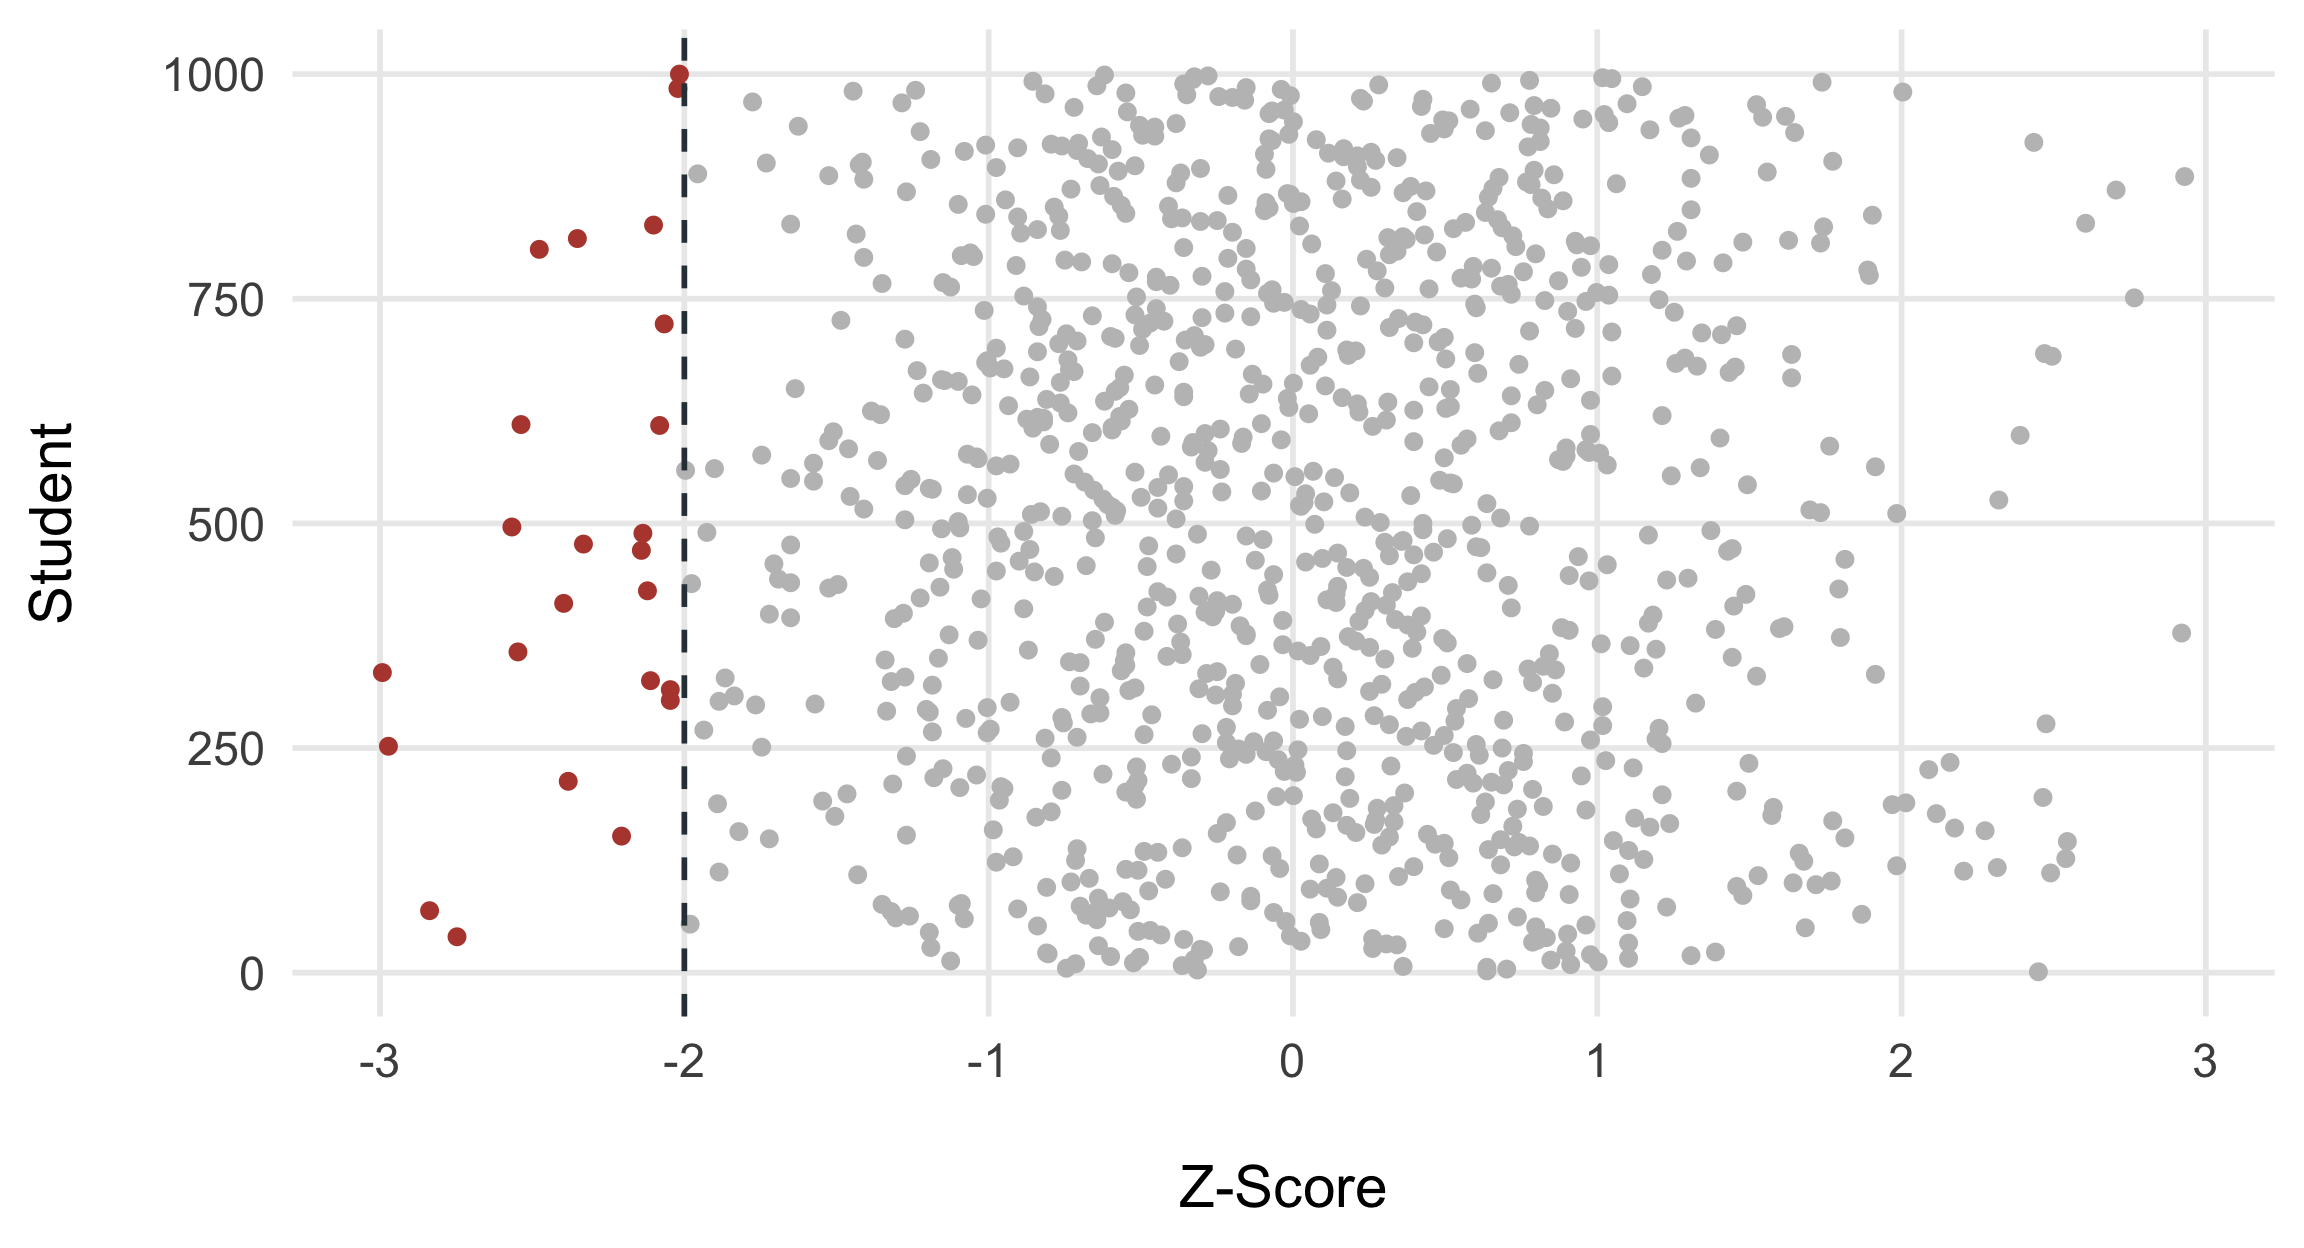
Who’s more than 2 SD below the mean?
Z-scores

Going backwards: Imagine that \(\color{#5C715E}{s} = 2\) and \(\color{#B5483B}{\bar{x}} = 25\)

Formula

\[x = \color{#B5483B}{\bar{x}} + z\,\color{#5C715E}{s}\]

  • \(z = 1 \Rightarrow x = 25 + (1)(2) = 27\)
  • \(z = -2 \Rightarrow x = 25 + (-2)(2) = 21\)
  • \(z = 0.5 \Rightarrow x = 25 + (0.5)(2) = 26\)

Calculating a Z-score

Step-by-Step

Two steps

  1. Mean-center the \(x\) values: \(x - \color{#B5483B}{\bar{x}}\) — this makes the mean \(= 0\).
  2. Divide by the standard deviation: \(\dfrac{x - \color{#B5483B}{\bar{x}}}{\color{#5C715E}{s}}\) — this makes the SD \(= 1\).

Calculating Probability

Use the normal distribution

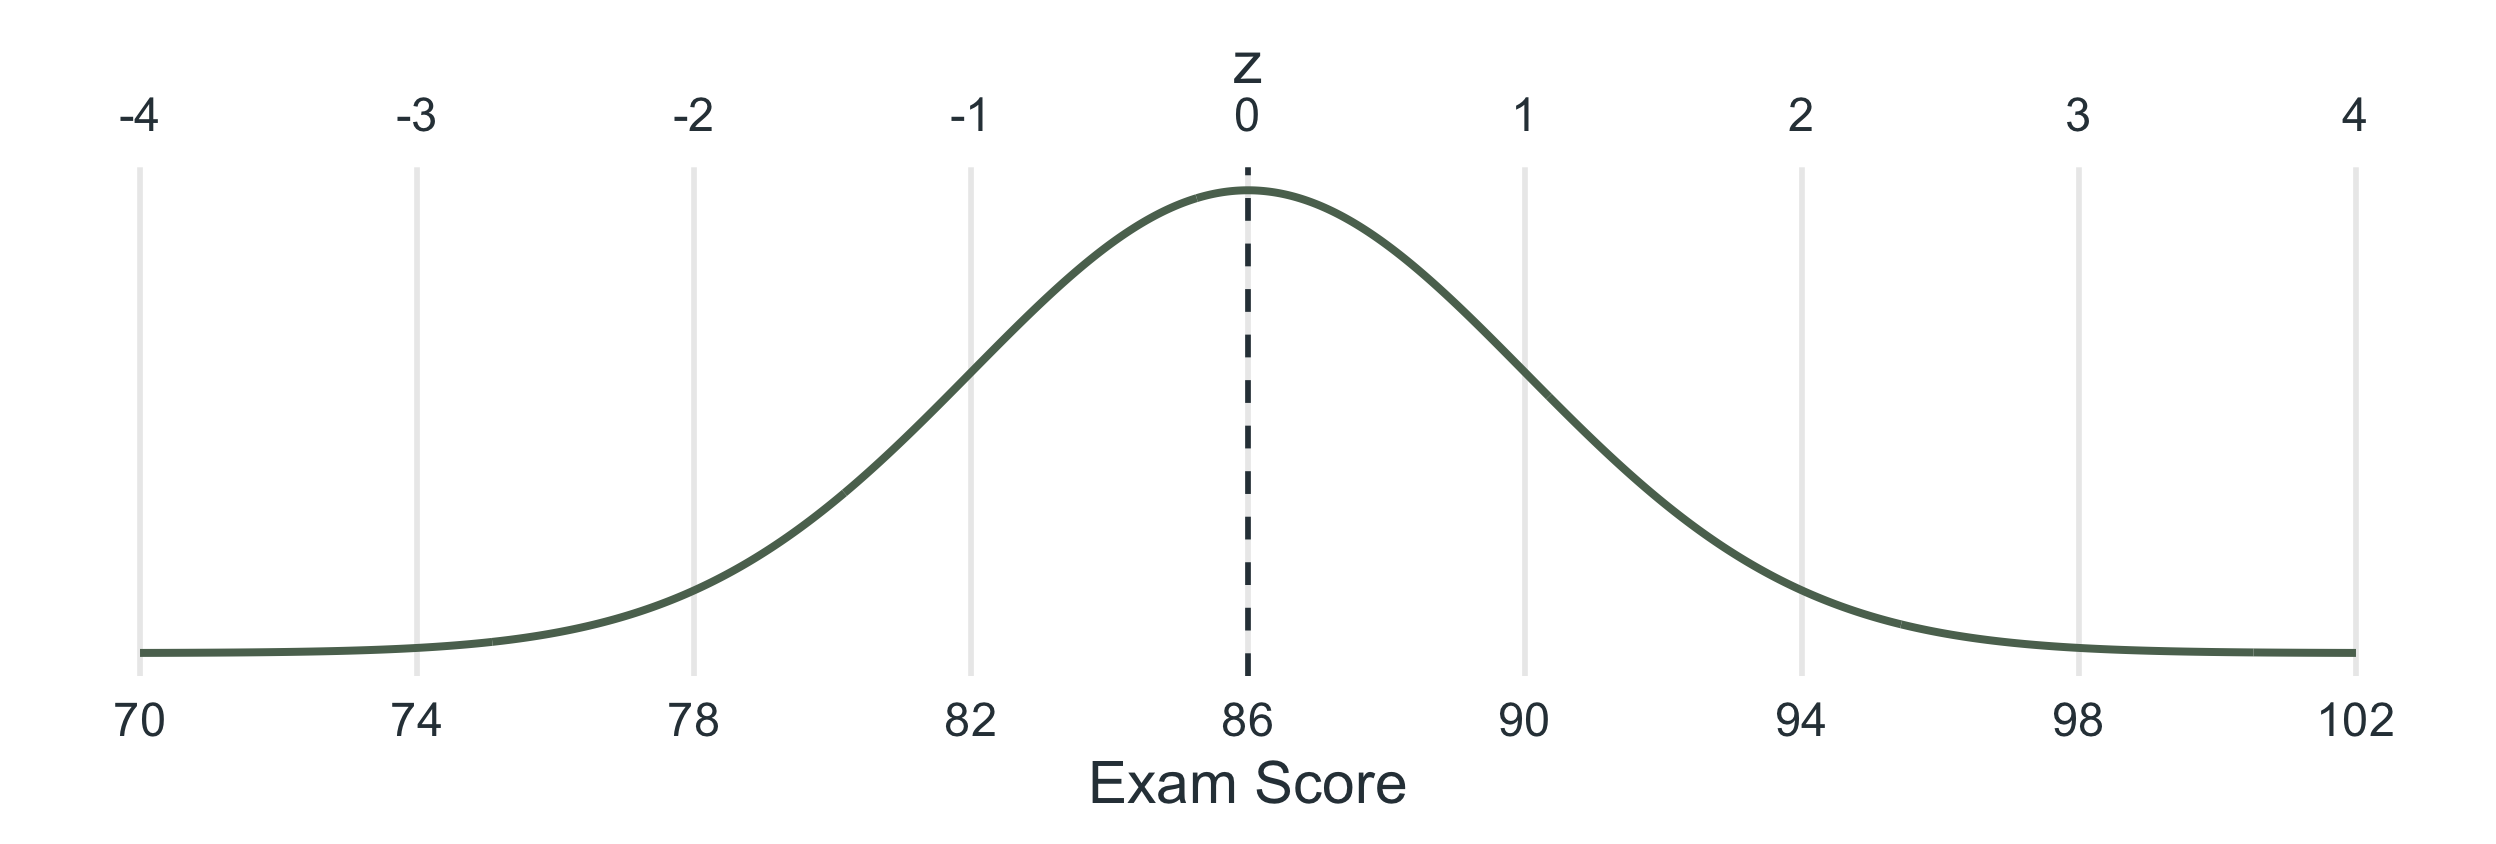
The average grade on the exam was an 86 with a standard deviation of 4.

Calculating Probability

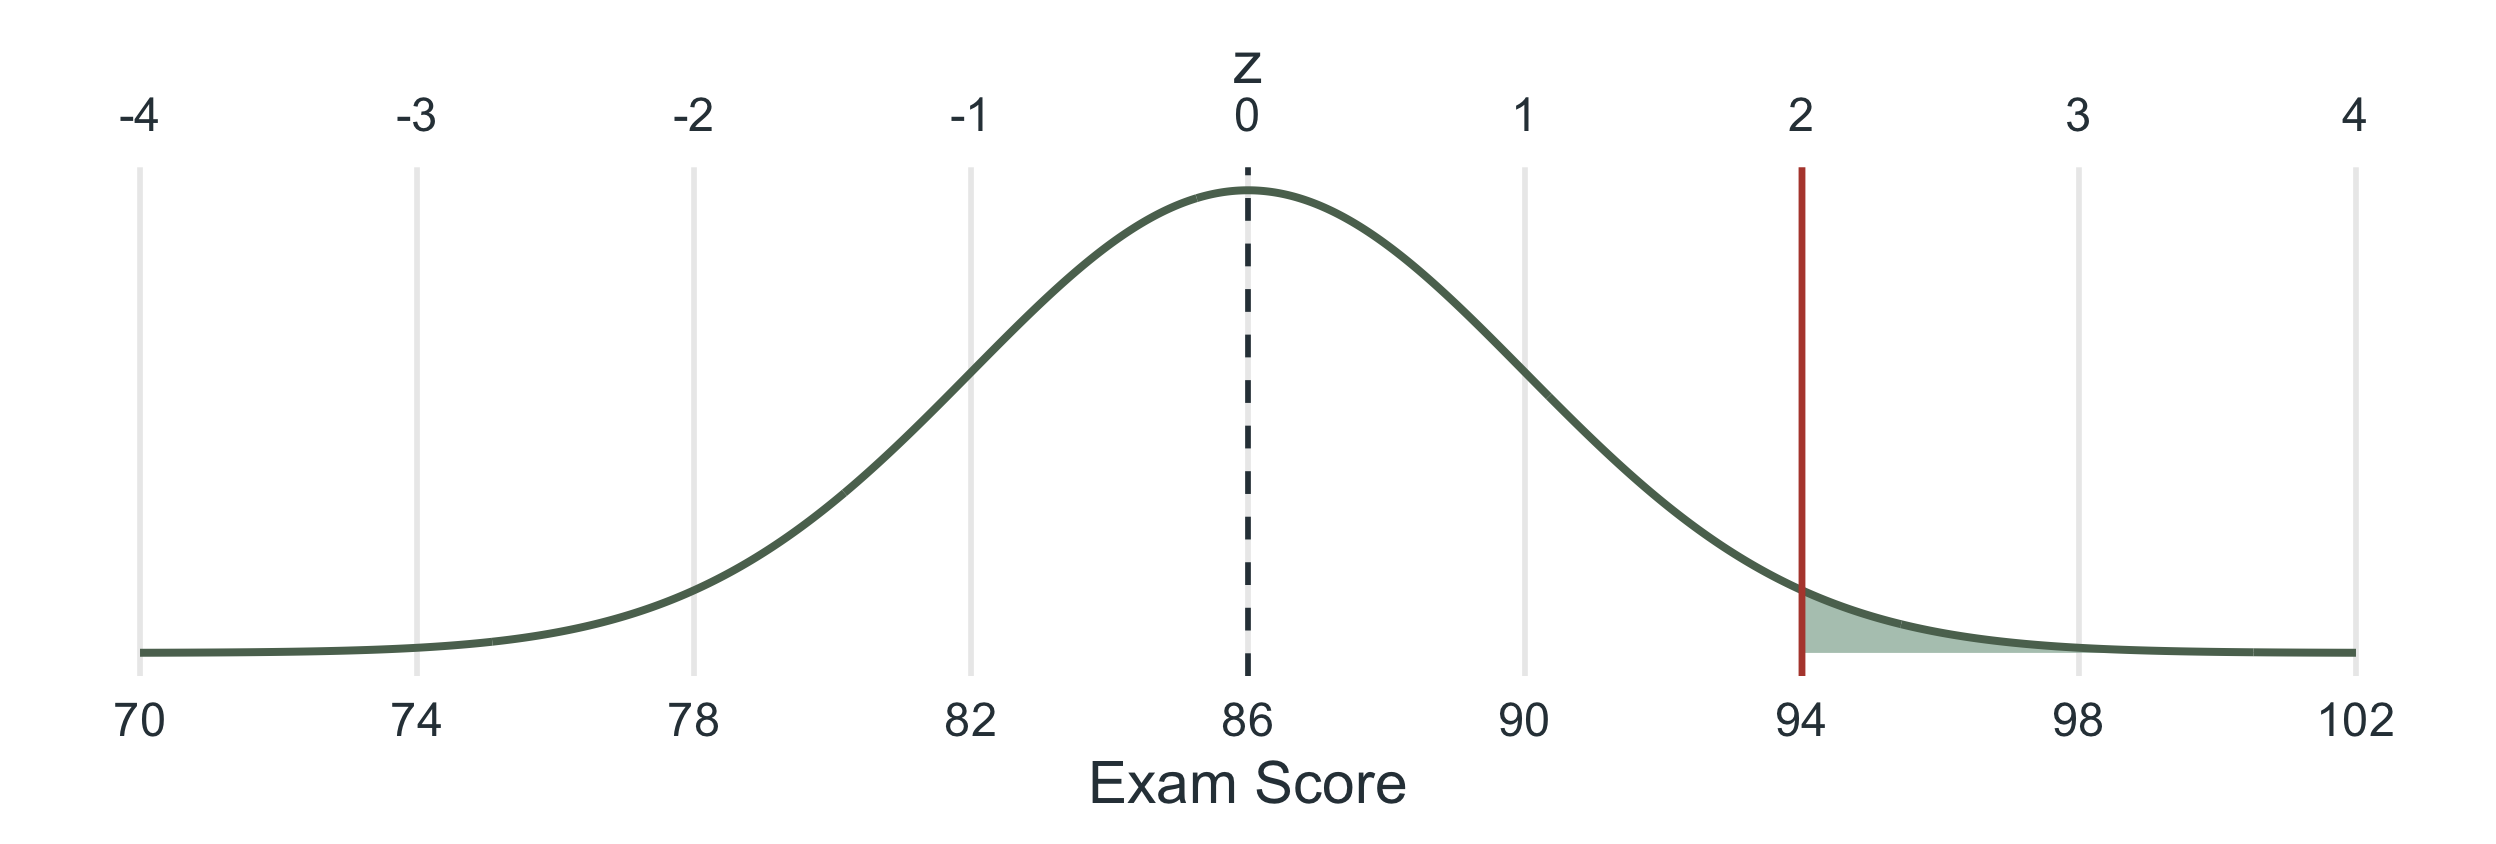
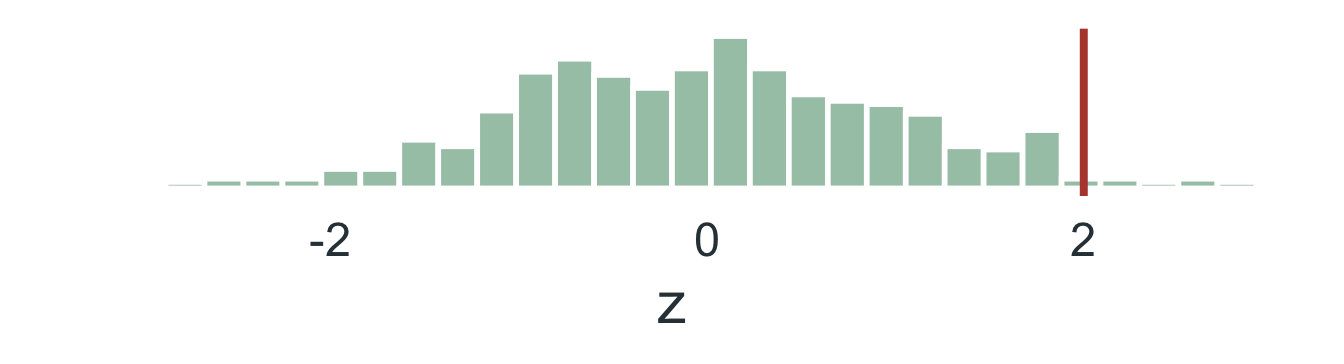
What is the probability of scoring a 94 or higher?

The average grade on the exam was an 86 with a standard deviation of 4.

Calculating Probability

What is the probability of scoring a 94 or higher?

Solution

  • \(z = \dfrac{x-\color{#B5483B}{\bar{x}}}{\color{#5C715E}{s}} = \dfrac{94-86}{4} = \dfrac{8}{4} = 2\)
  • Beyond \(z = 2\) is the 2.1% + 0.1% slivers of the curve ≈ 2.3% chance.

Example 2

Test Time!

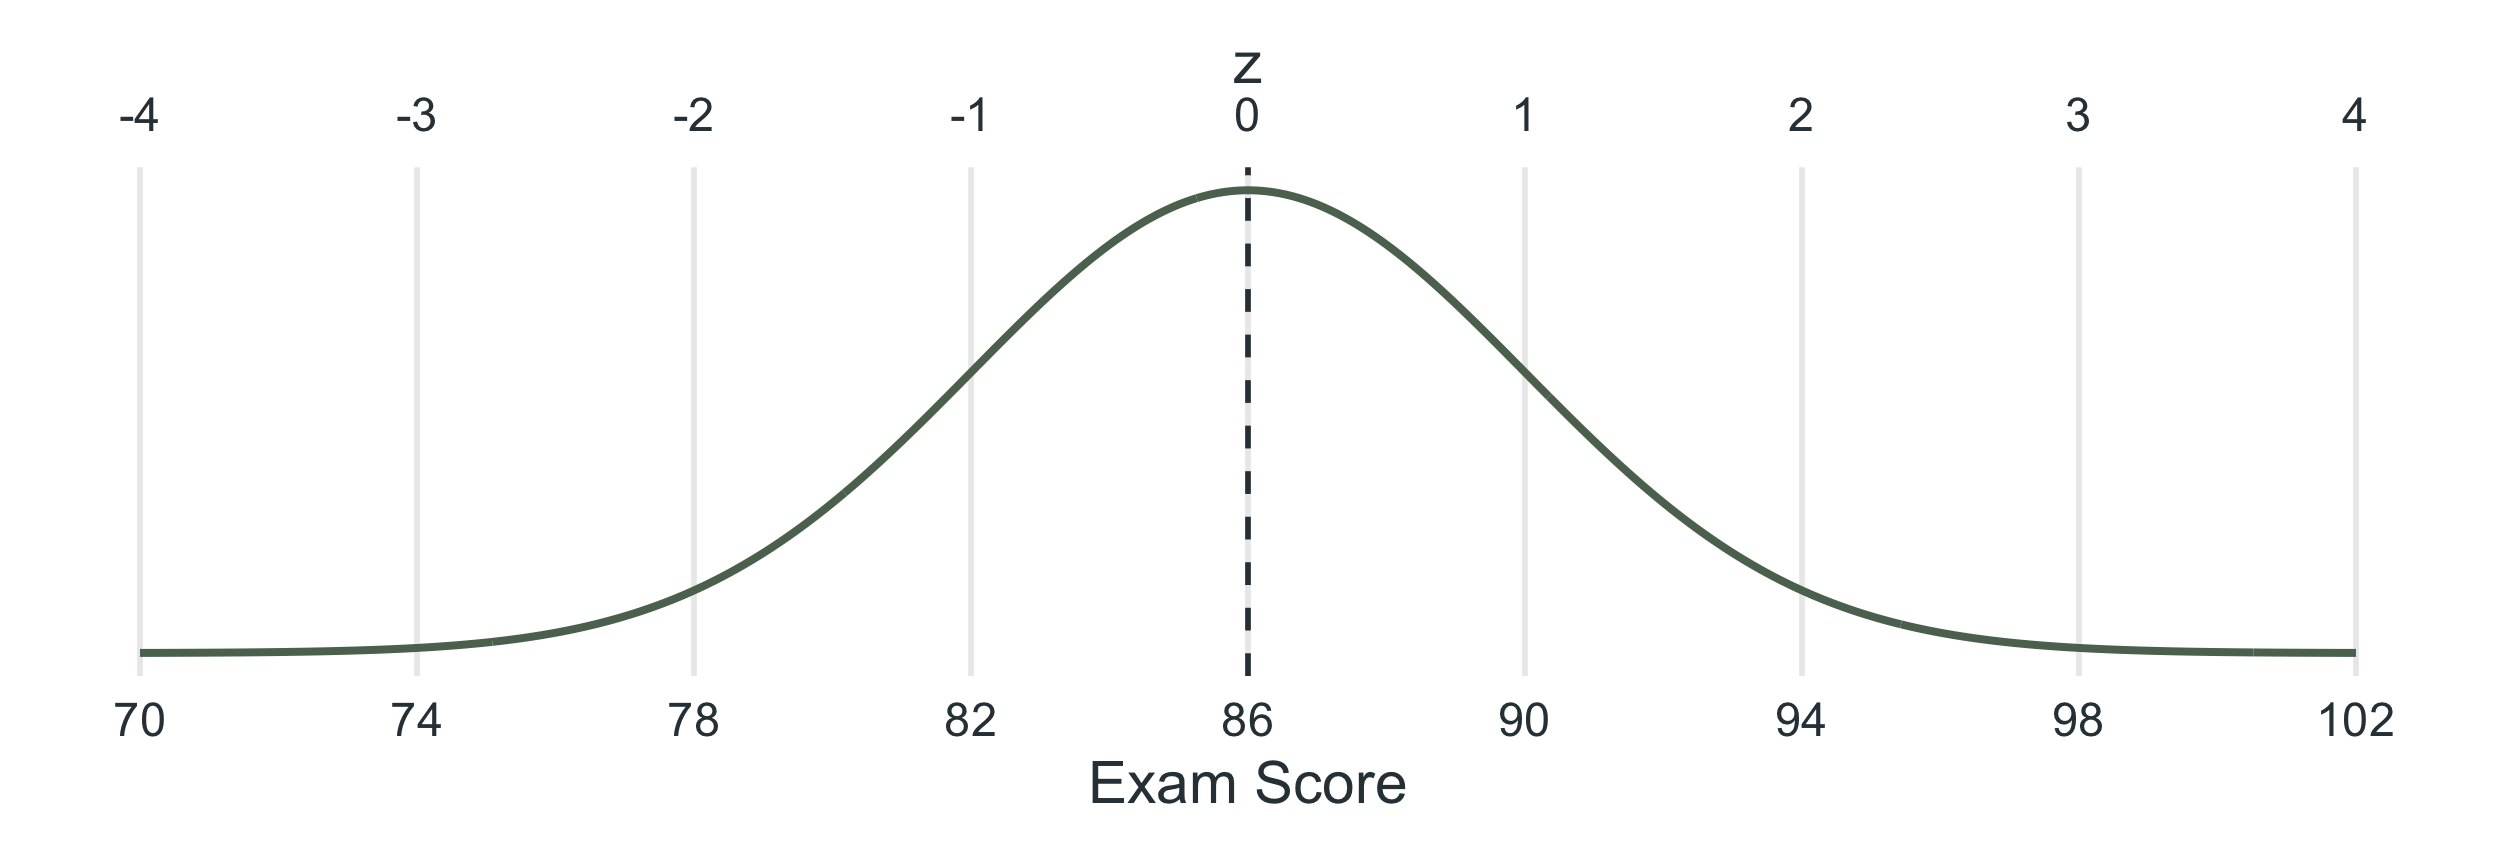
The mean exam score was 86 with a standard deviation of 4. What is the probability of scoring between an 82 and a 90?

Example 2

Test Time!

The mean exam score was 86 with a standard deviation of 4. What is the probability of scoring between an 82 and a 90?

Example 2

Test Time!

Solution

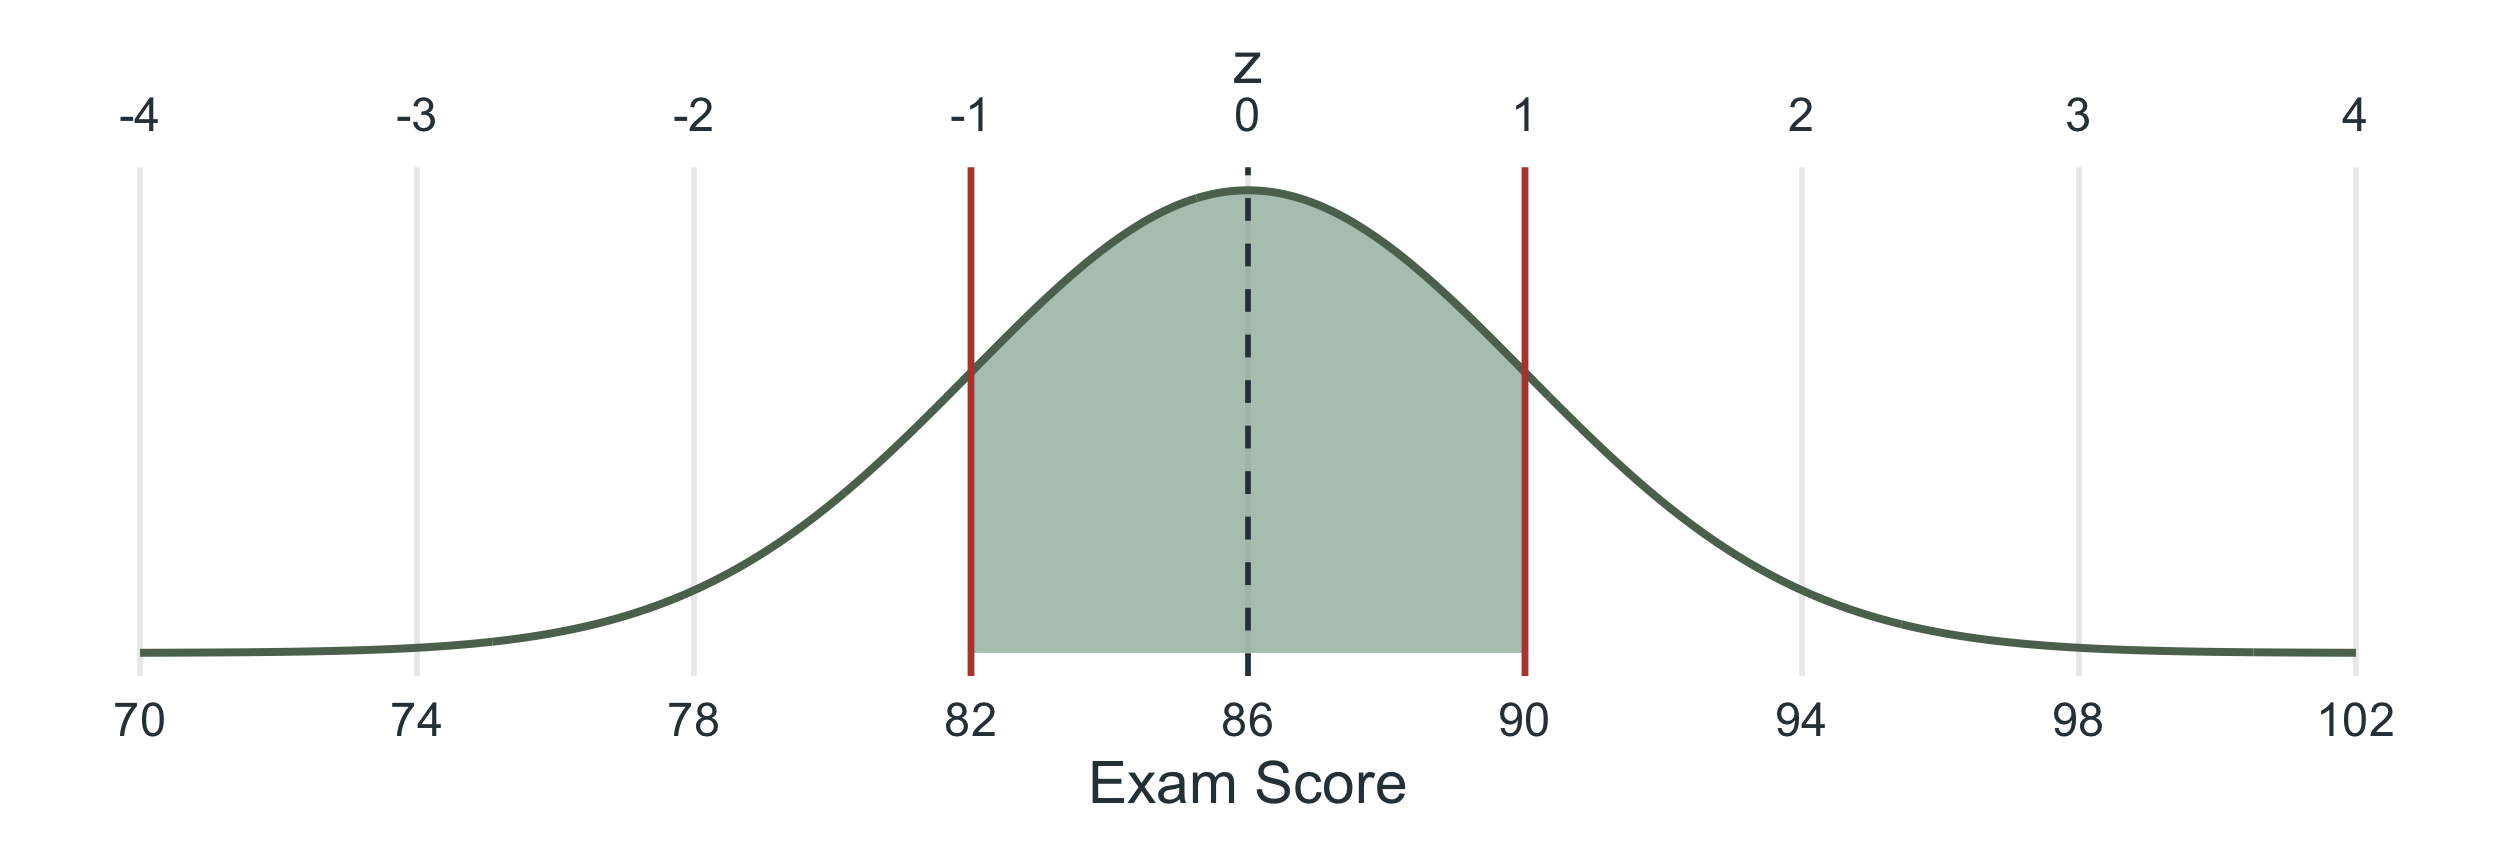
  • \(z = \dfrac{82-86}{4} = \dfrac{-4}{4} = -1\)
  • \(z = \dfrac{90-86}{4} = \dfrac{4}{4} = 1\)
  • Between \(z = -1\) and \(z = 1\): a 68.3% chance of scoring between 82 and 90.

Example 3

Esmeralda’s Second Test

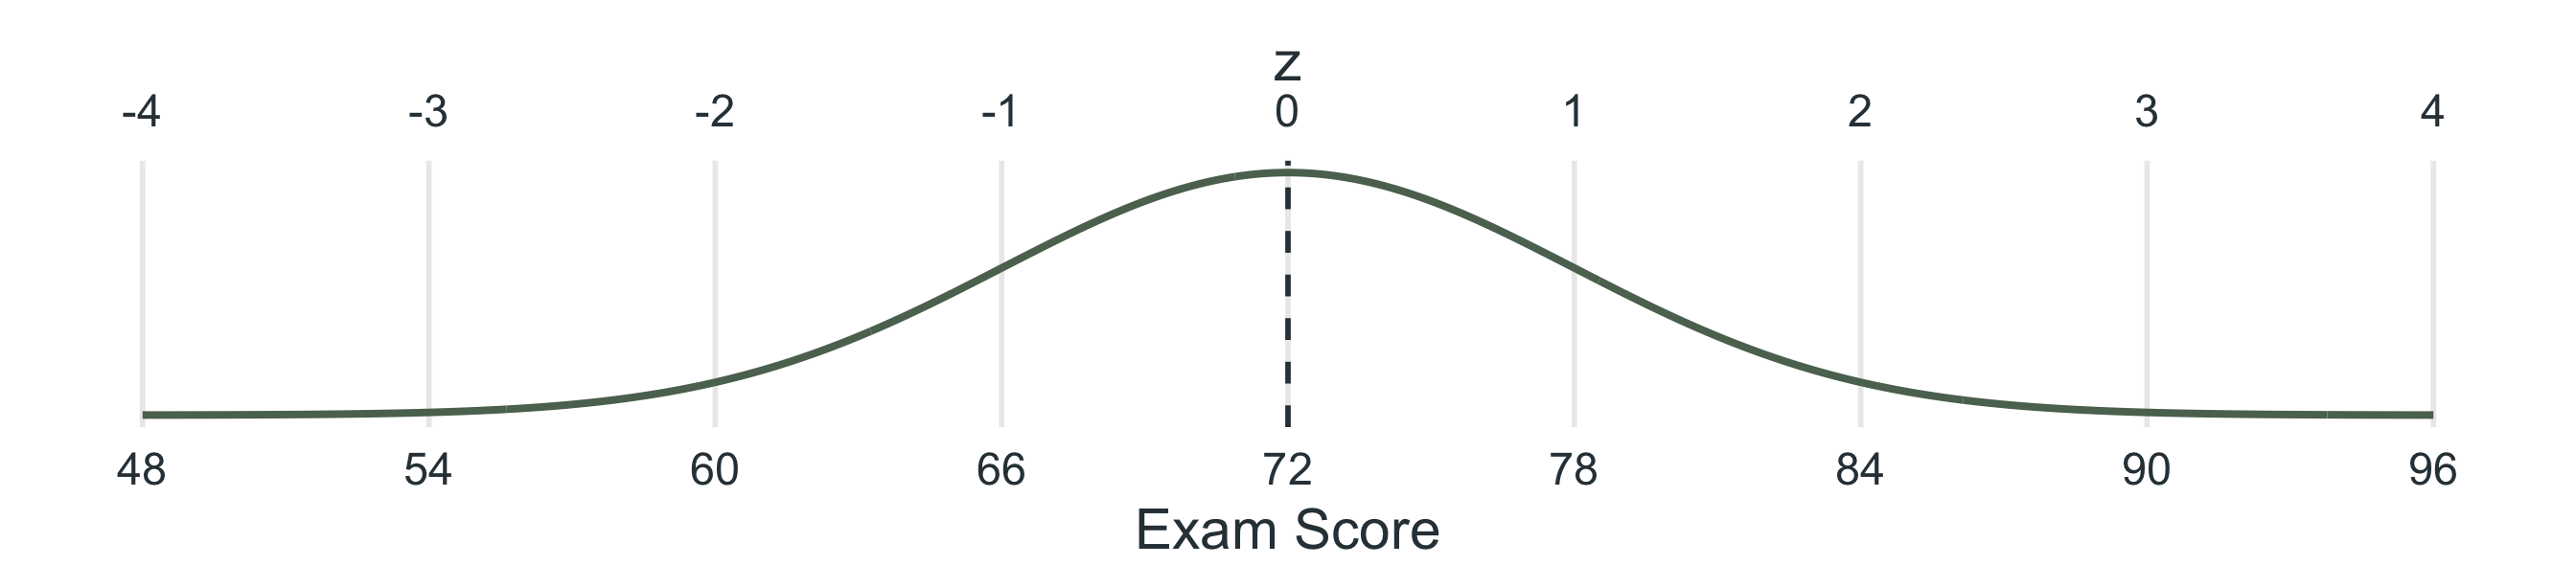
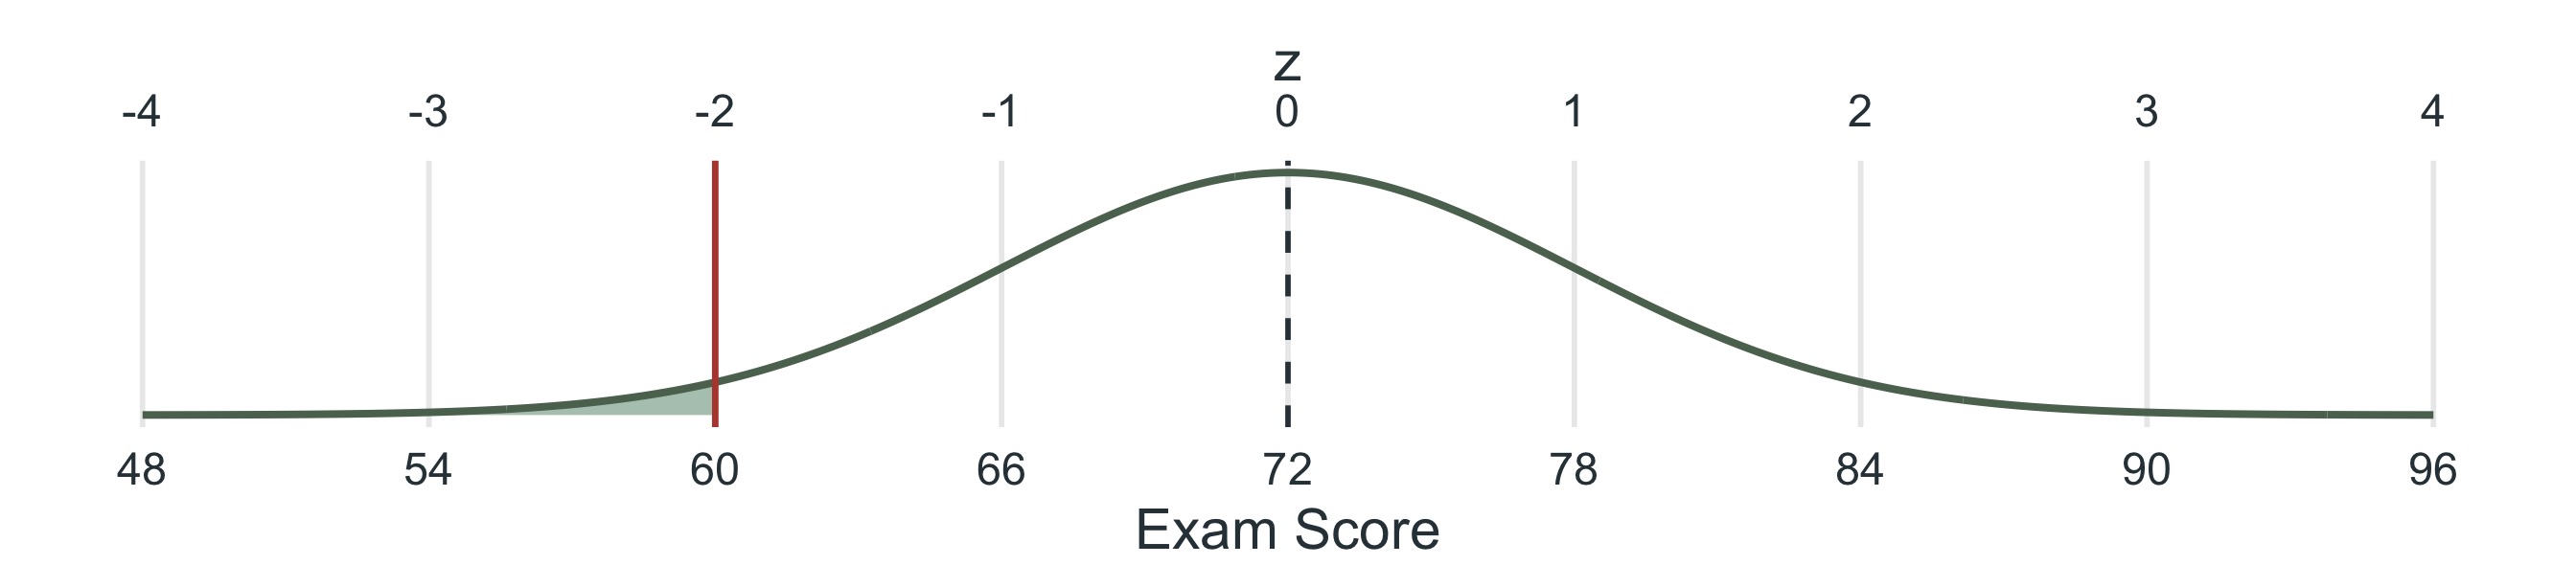
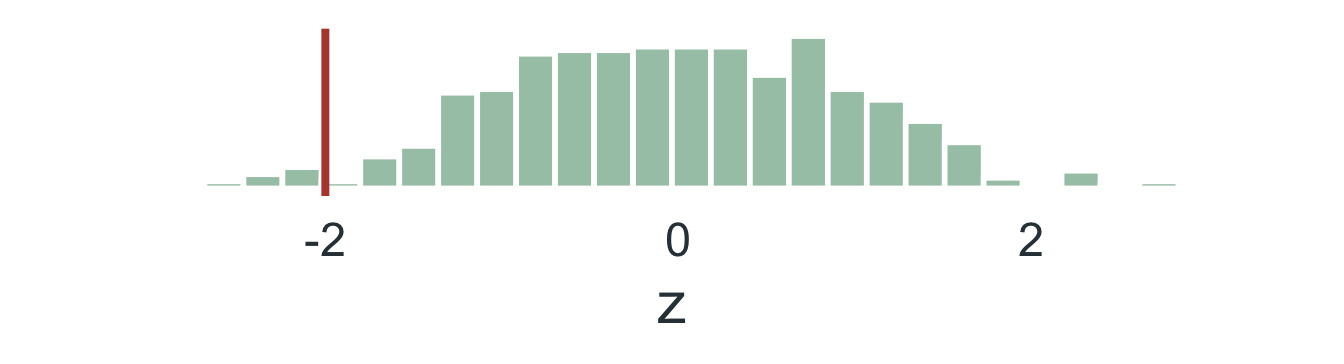
Esmeralda’s stats professor tells the class that the average score on the exam was a 72 with a standard deviation of 6, and the distribution of scores was normal. Esmeralda wants to calculate the probability that she scored below 60.

Example 3

Esmeralda’s Second Test

Esmeralda’s stats professor tells the class that the average score on the exam was a 72 with a standard deviation of 6, and the distribution of scores was normal. Esmeralda wants to calculate the probability that she scored below 60.

Example 3

Esmeralda’s Second Test: \(\color{#B5483B}{\bar{x}} = 72 \mid \color{#5C715E}{s} = 6\)

Solution

  • \(z = \dfrac{60-72}{6} = \dfrac{-12}{6} = -2\)
  • About a 2.3% chance that she failed.
  • What’s the chance she passed?
  • \(100\% - 2.3\% = 97.7\%\)

Z-scores and Probability

How does it apply?

In real life, we are usually working with numbers with long decimals rather than nice whole numbers.

  • Because the standard normal curve is standard and normal, we can look up the exact probability for a z-score with decimals.

Z-scores and Probability

The Z-Table

  • Locate the whole number and first decimal along the left side of the table.
  • Locate the second decimal along the top of the table.
  • Where they meet is the proportion of the curve at or below that z.

Unable to display PDF file. Download instead.

Z-scores and Probability

The Z-Table

Rule

The z-table gives you the probability of that z-score or less (the area to the left).

  • If you need that z-score or higher, subtract the table value from 1.
    • Esmeralda: .023 chance of failing, so a 1 - .023 = .977 → 97.7% chance of passing.

Z-scores and Probability

Life Satisfaction

In a recent study on world happiness, participants were asked to evaluate their current lives on a scale from 0 to 10, where 0 represents the worst possible life and 10 represents the best possible life. The responses were normally distributed, with a mean of 5.4 and a standard deviation of 2.2. Find the probability that a randomly selected study participant’s response was:

  • Less than 4
  • More than 8

Z-scores and Probability

Life Satisfaction: \(\color{#B5483B}{\bar{x}} = 5.4 \mid \color{#5C715E}{s} = 2.2\)

Convert to z first

  • Less than 4: \(z = \dfrac{4-5.4}{2.2} = \dfrac{-1.4}{2.2} = -0.64\)
  • More than 8: \(z = \dfrac{8-5.4}{2.2} = \dfrac{2.6}{2.2} = 1.18\)

Life Satisfaction

Less than 4 (\(z = -0.64\))

Excerpt of the z-table (area to the left of z)
z .02 .03 .04 .05 .06
-0.5 0.3015 0.2981 0.2946 0.2912 0.2877
-0.6 0.2676 0.2643 0.2611 0.2578 0.2546
-0.7 0.2358 0.2327 0.2296 0.2266 0.2236
  • Find -0.6 on the left side of the table — use the negative-z page.
  • Find the .04 column.
  • Where they meet is the area to the left — that is the probability we want.
  • Report it as a percentage (the proportion \(\times 100\)).
Reveal Answer
  • \(.2611 \times 100 =\) 26.1% of participants rated their life below a 4.

pnorm.R

pnorm(-0.64)                        # .2611 (z-table)
pnorm(4, mean = 5.4, sd = 2.2)      # .2623 (unrounded z)

pnorm (probability) is the z-table: z in, area to the left out. qnorm (quantile) is the reverse: probability in, z out.

Life Satisfaction

More than 8 (\(z = 1.18\))

Excerpt of the z-table (area to the left of z)
z .06 .07 .08 .09
1.0 0.8554 0.8577 0.8599 0.8621
1.1 0.8770 0.8790 0.8810 0.8830
1.2 0.8962 0.8980 0.8997 0.9015
  • Find 1.1 on the left side of the table.
  • Find the .08 column.
  • Note where they intersect.
  • We want 8 or more, so subtract that proportion from 1.
  • Report it as a percentage (the proportion \(\times 100\)).
Reveal Answer
  • \(1 - .8810 = .1190\)
  • 11.9% of participants rated their life above an 8.

pnorm.R

1 - pnorm(1.18)                                              # .1190 (z-table)
pnorm(8, mean = 5.4, sd = 2.2, lower.tail = FALSE)           # .1186 (unrounded z)

pnorm (probability) is the z-table: z in, area to the left out. qnorm (quantile) is the reverse: probability in, z out.

Z-scores and Probability

MENSA

Scores on an IQ test are approximately normal with a mean of 100 and a standard deviation of 15. The organization MENSA, which calls itself the “high IQ society,” requires a score of 130 or higher.

  • What percent of adults would qualify for membership?
    • Find the probability of scoring 130 or higher.
    • \(z = \dfrac{x-\color{#B5483B}{\bar{x}}}{\color{#5C715E}{s}} = \dfrac{130-100}{15} = \dfrac{30}{15} = 2\)

MENSA

\(\color{#B5483B}{\bar{x}} = 100 \mid \color{#5C715E}{s} = 15\) — 130 or higher (\(z = 2.00\))

Excerpt of the z-table (area to the left of z)
z .00 .01 .02
1.9 0.9713 0.9719 0.9726
2.0 0.9772 0.9778 0.9783
2.1 0.9821 0.9826 0.9830
  • Find 2.0 on the left side of the table.
  • Find the .00 column.
  • Note where they intersect.
  • We want 130 or more, so subtract that proportion from 1.
  • Report it as a percentage (the proportion \(\times 100\)).
Reveal Answer
  • \(1 - .9772 = .0228\)
  • About 2.3% of adults would qualify for MENSA.

pnorm.R

1 - pnorm(2)                                                 # .0228 (z-table)
pnorm(130, mean = 100, sd = 15, lower.tail = FALSE)          # .0228

pnorm (probability) is the z-table: z in, area to the left out. qnorm (quantile) is the reverse: probability in, z out.

Z-table clarity

The table only ever looks left

Hover over the curve. Shaded = the table value. Left of z: read it directly. Right of z: 1 minus the table value. Between: big area minus small area. The “1 minus” applies to the area, never to \(z\).

Z-scores

“Compared to what?” is everywhere

Newborn weight

Is a 4.3 kg baby big? (\(\mu = 3.4\), \(\sigma = 0.5\))
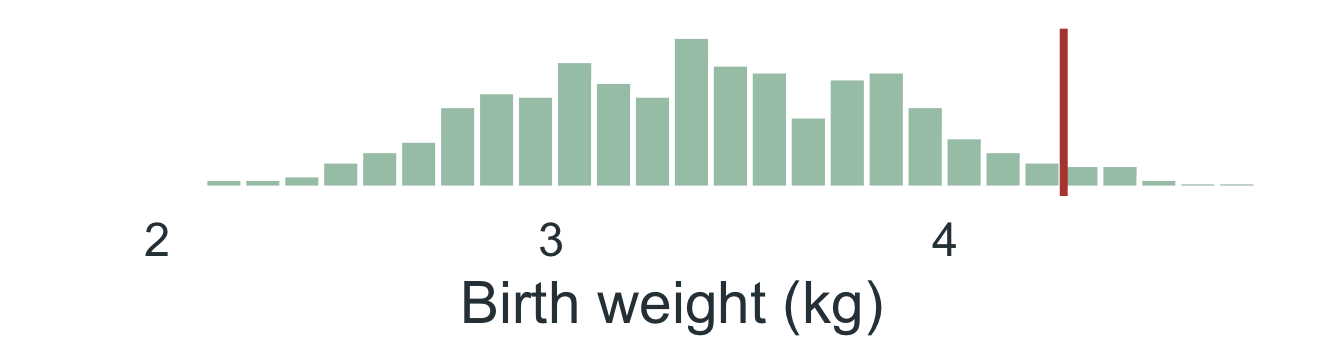
\(z = \dfrac{4.3-3.4}{0.5} = 1.8\). Growth charts report exactly this.

Daily screen time

Is 7 hours a lot? (\(\mu = 4.5\), \(\sigma = 1.5\))
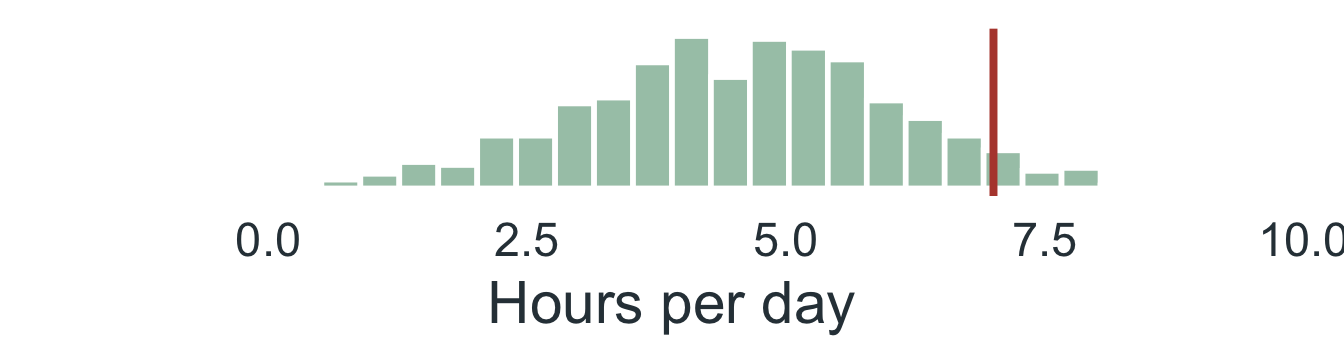
\(z = \dfrac{7-4.5}{1.5} = 1.67\)

Bolt diameter

Is 10.10 mm out of spec? (\(\mu = 10.00\), \(\sigma = 0.05\))
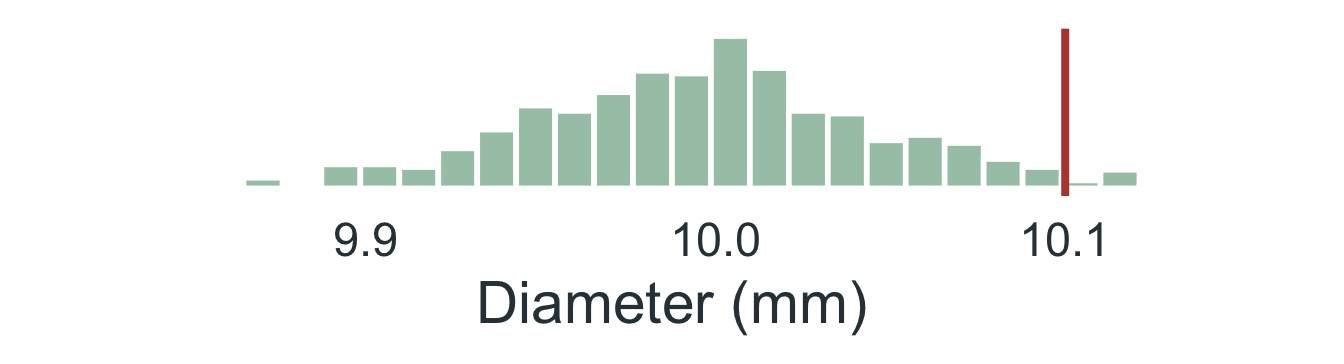
\(z = \dfrac{10.10-10.00}{0.05} = 2.0\). Quality control flags this.

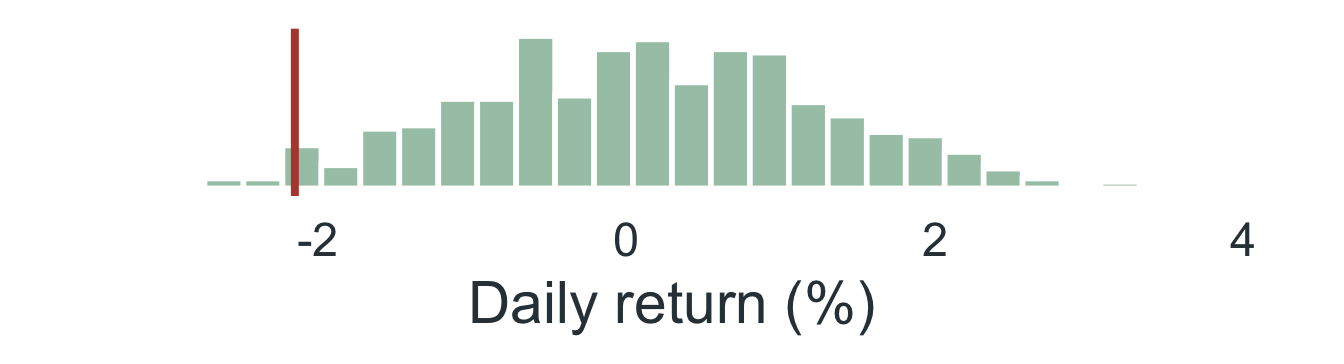
One-day stock return

Is a \(-2.15\%\) day unusual? (\(\mu = 0.05\%\), \(\sigma = 1.1\%\))

\(z = \dfrac{-2.15-0.05}{1.1} = -2.0\)