Z = 2 corresponds with 2.1% and 0.1% of the curve (2.2%) chance.
Example 2
Test Time!
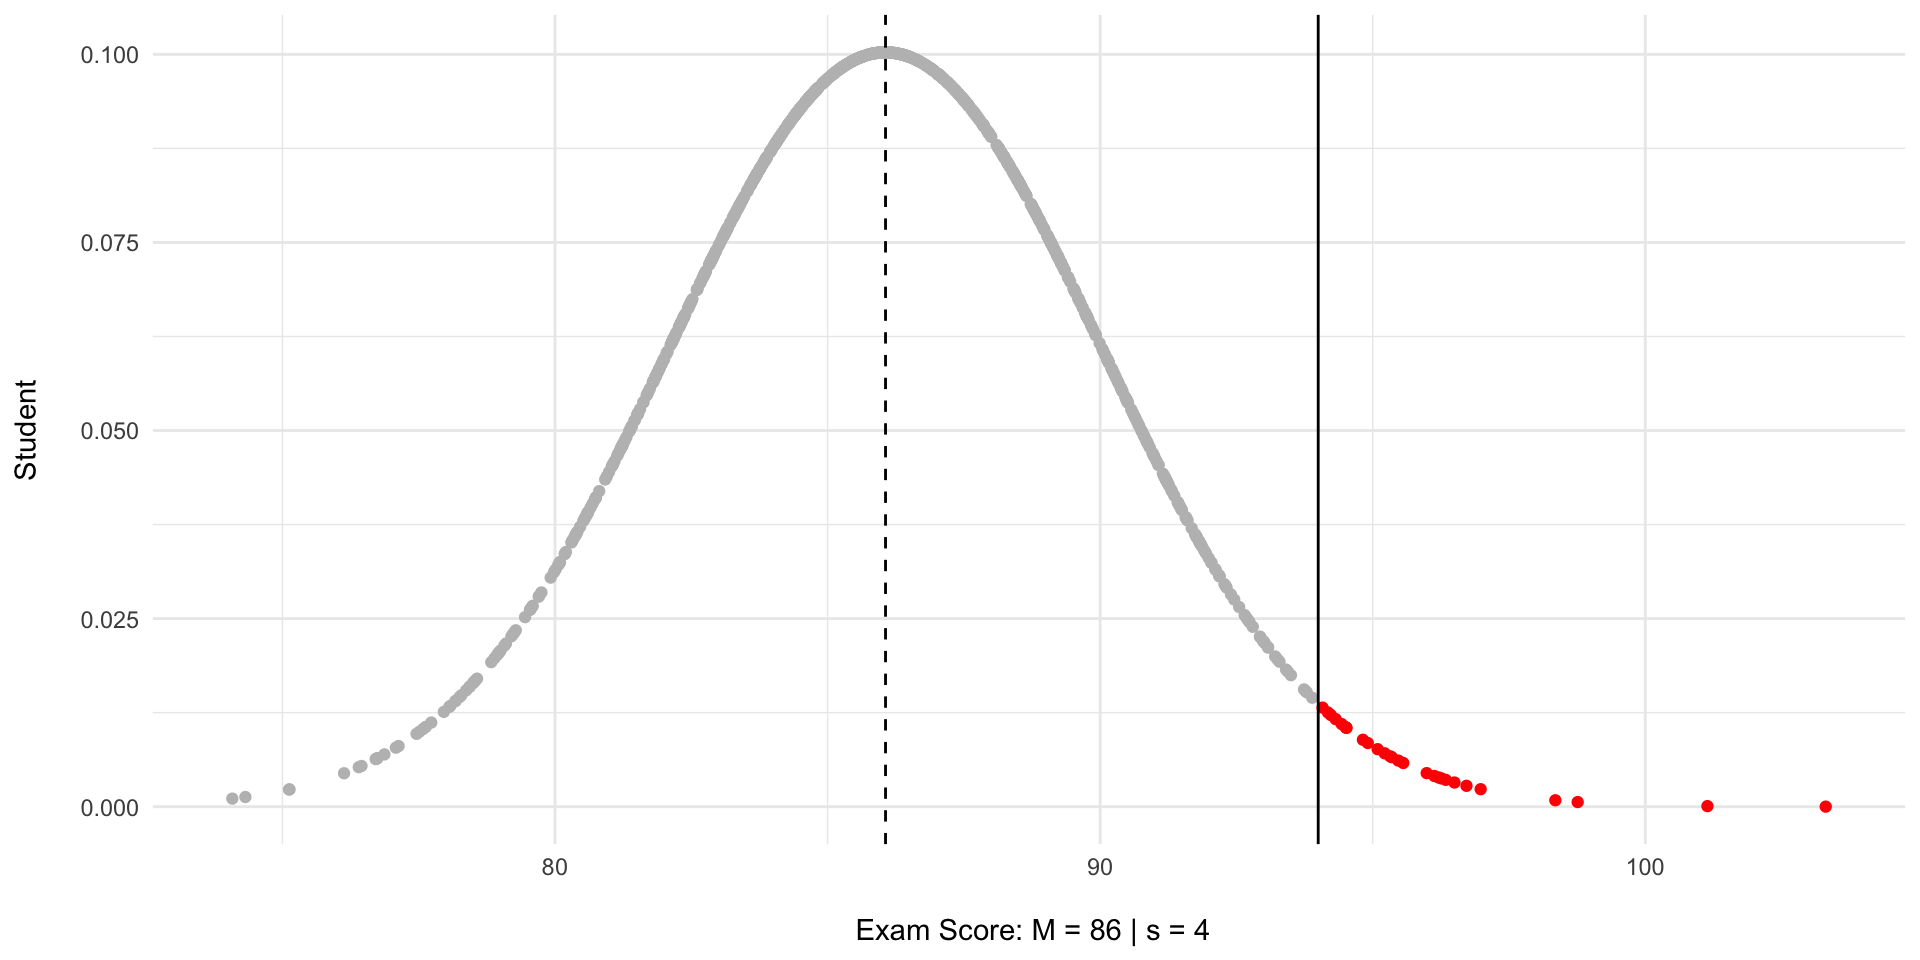
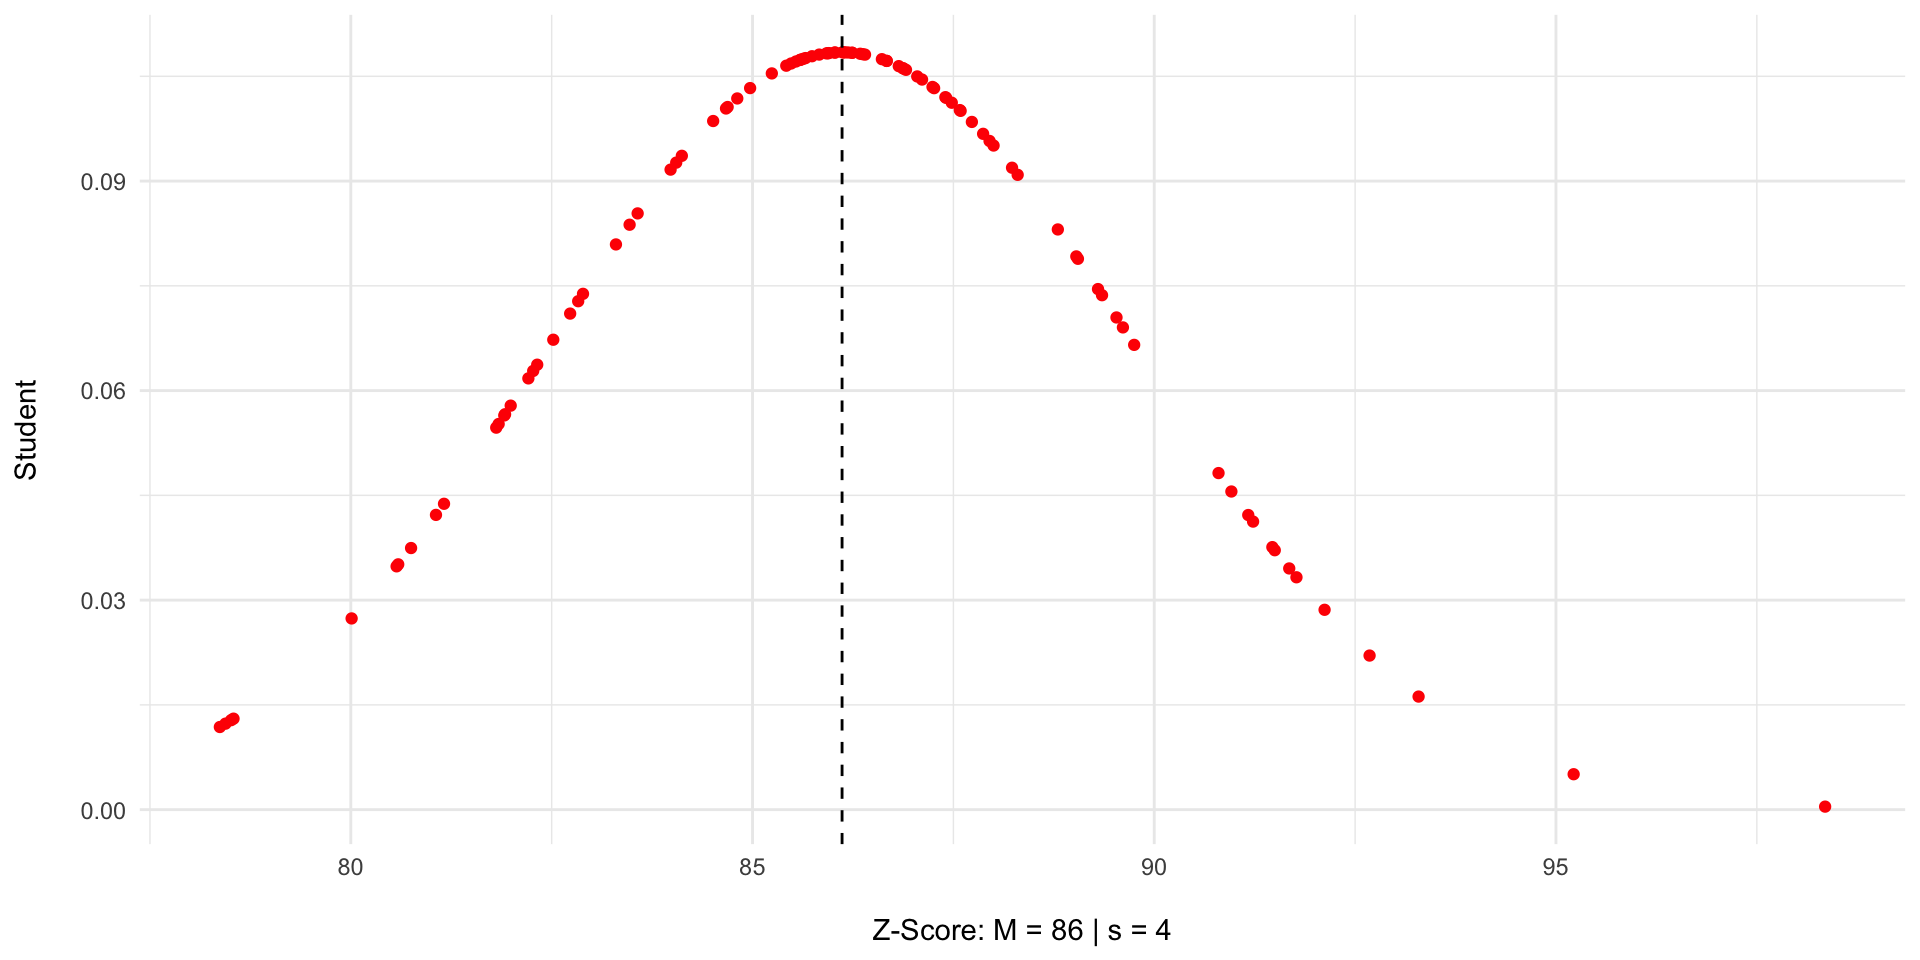
The mean exam score was 86 with a standard deviation of 4. What is the probability of scoring between an 82 and a 90?
Example 2
Test Time!
The mean exam score was 86 with a standard deviation of 4. What is the probability of scoring between an 82 and a 90?
Example 2
Esmeralda’s Second Test
What is the probability of scoring between an 82 and a 90?
\(z = \frac{82-86}{4} = \frac{-4}{4} = -1\)
\(z = \frac{90-86}{4} = \frac{4}{4} = 1\)
There is a 68.3% chance of scoring between 82 and 90.
Example 3
Esmeralda’s Second Test
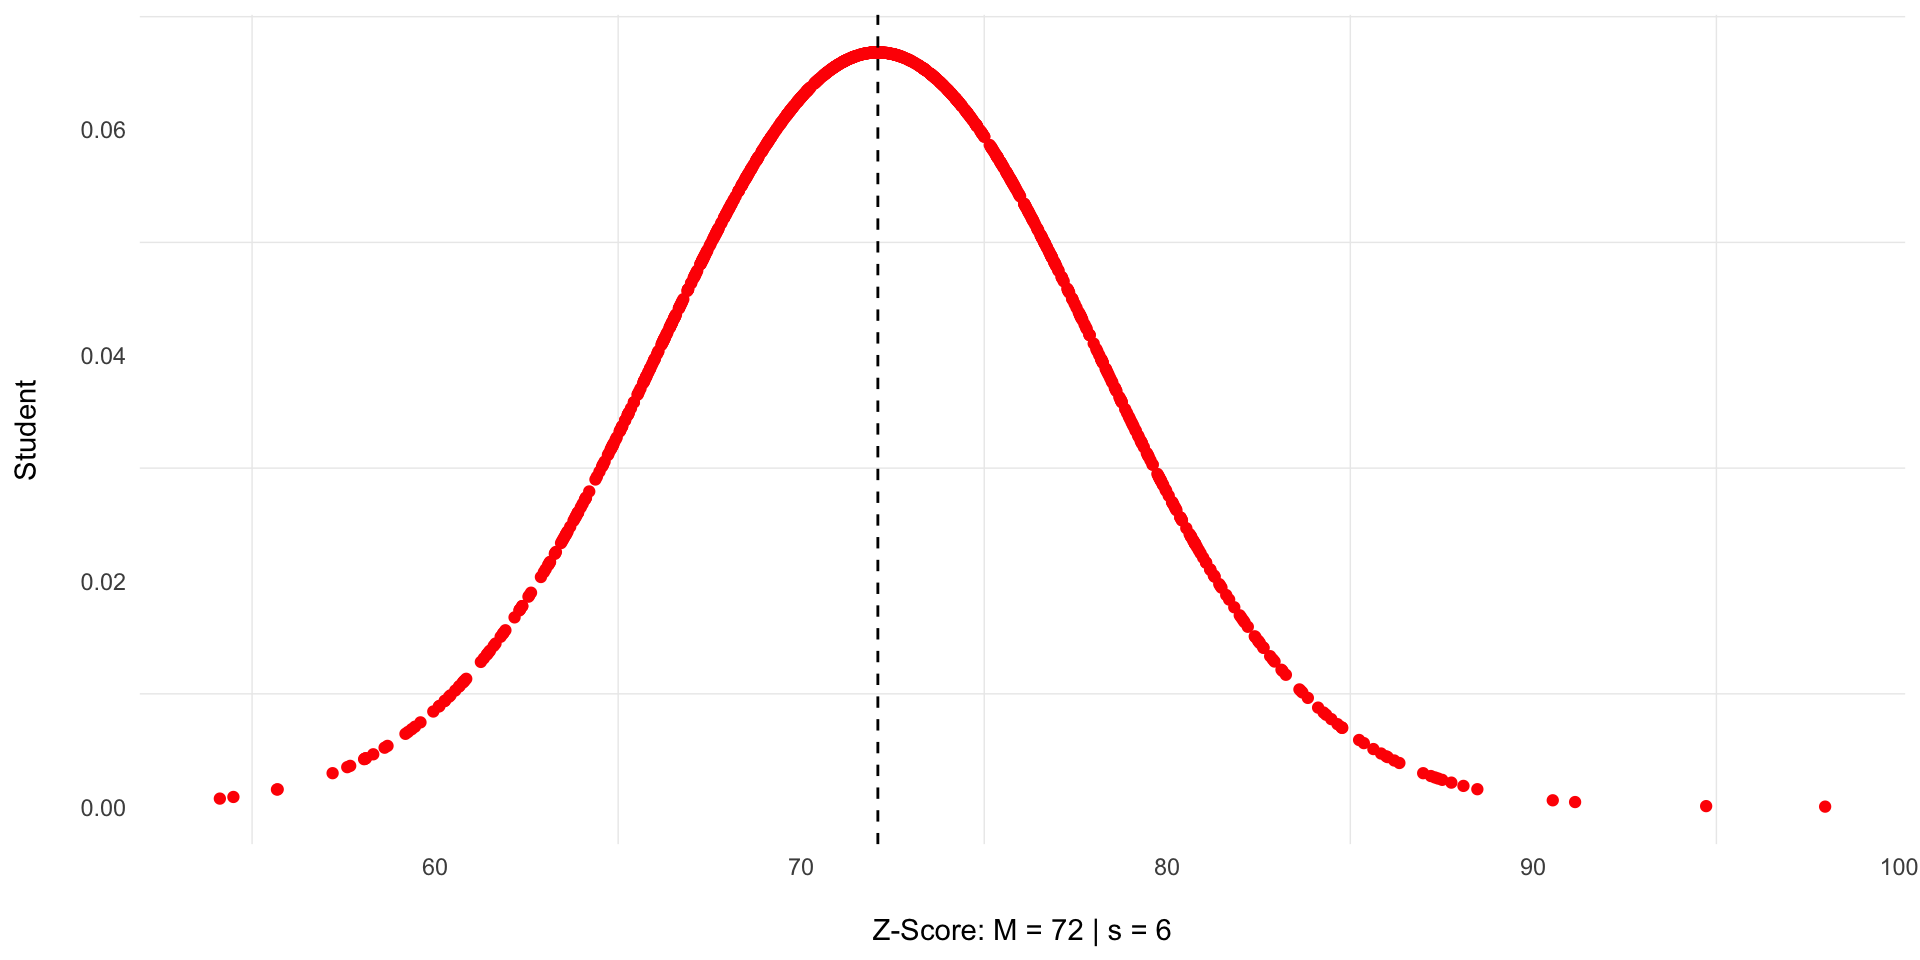
Esmeralda’s stats professor tells her class that the average score on the exam was a 72 with a standard deviation of 6, and the distribution of scores was normal. Esmeralda wants to calculate the probability that she scored below 60
Example 3
Esmeralda’s Second Test
Esmeralda’s stats professor tells her class that the average score on the exam was a 72 with a standard deviation of 6, and the distribution of scores was normal. Esmeralda wants to calculate the probability that she scored below 60
Example 3
Esmeralda’s Second Test: \(\bar{x} = 72 | s = 6\)
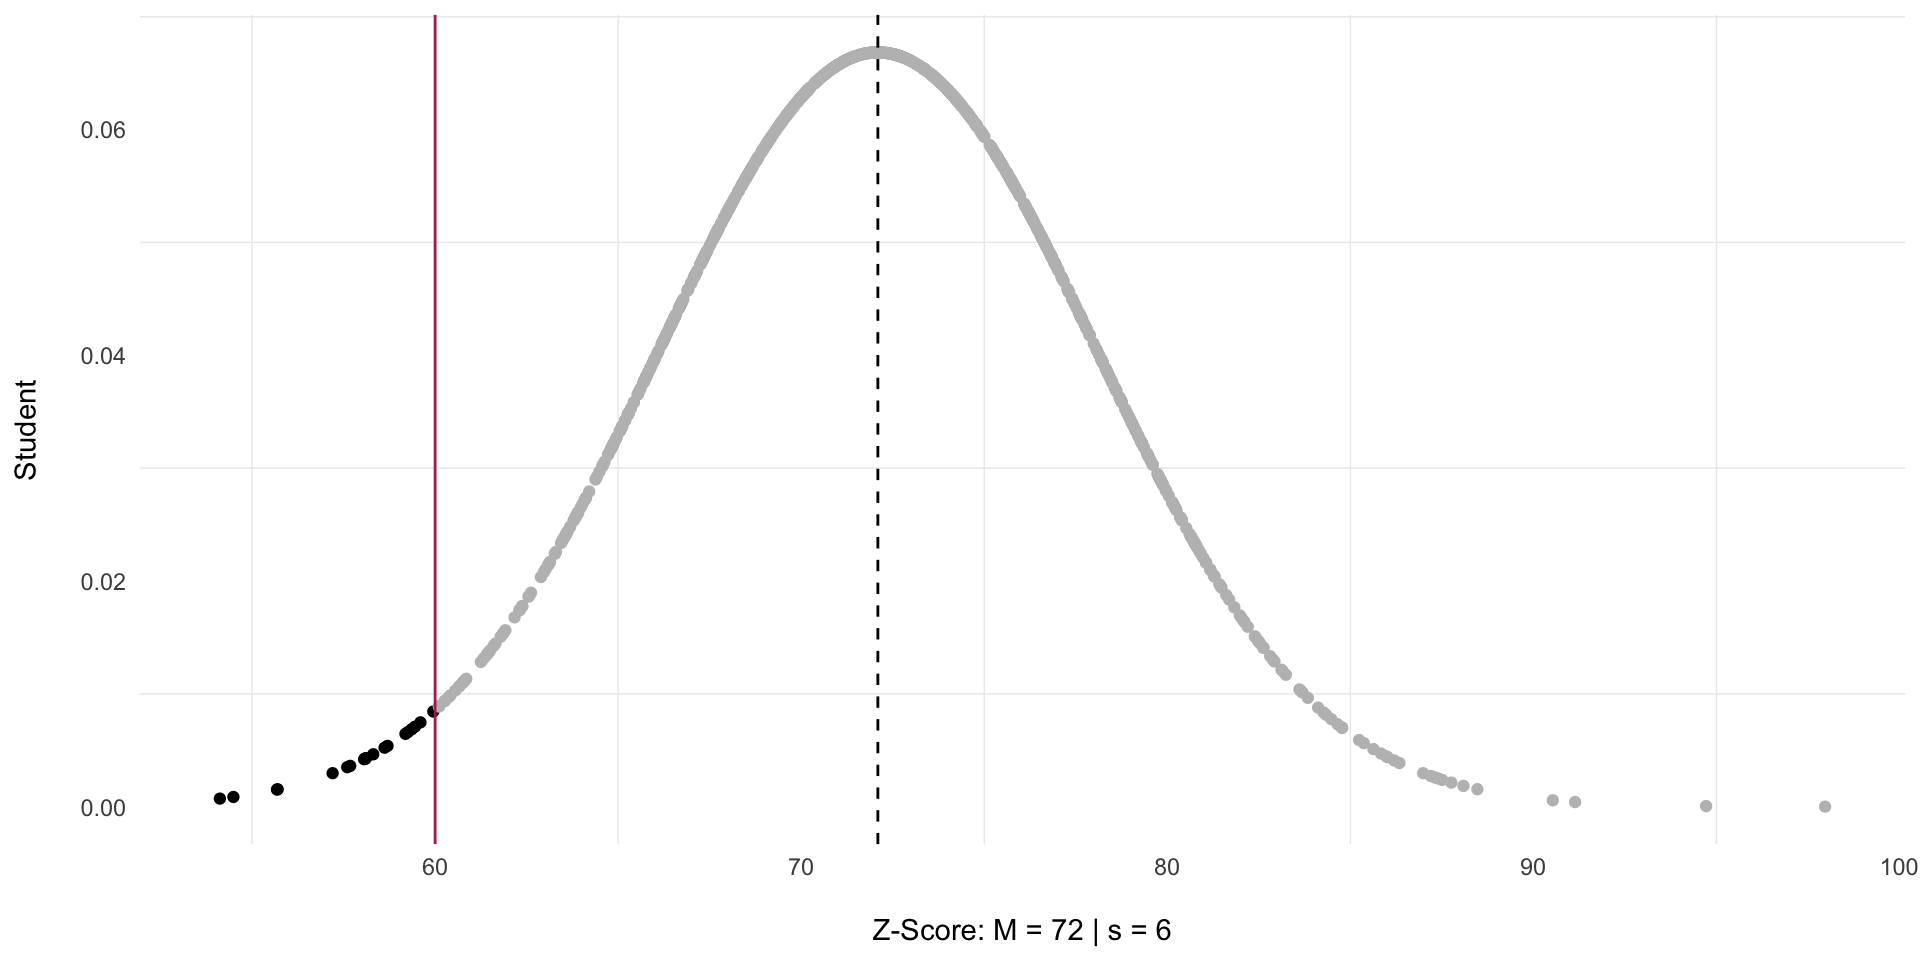
Esmeralda wants to calculate the probability that she scored below 60
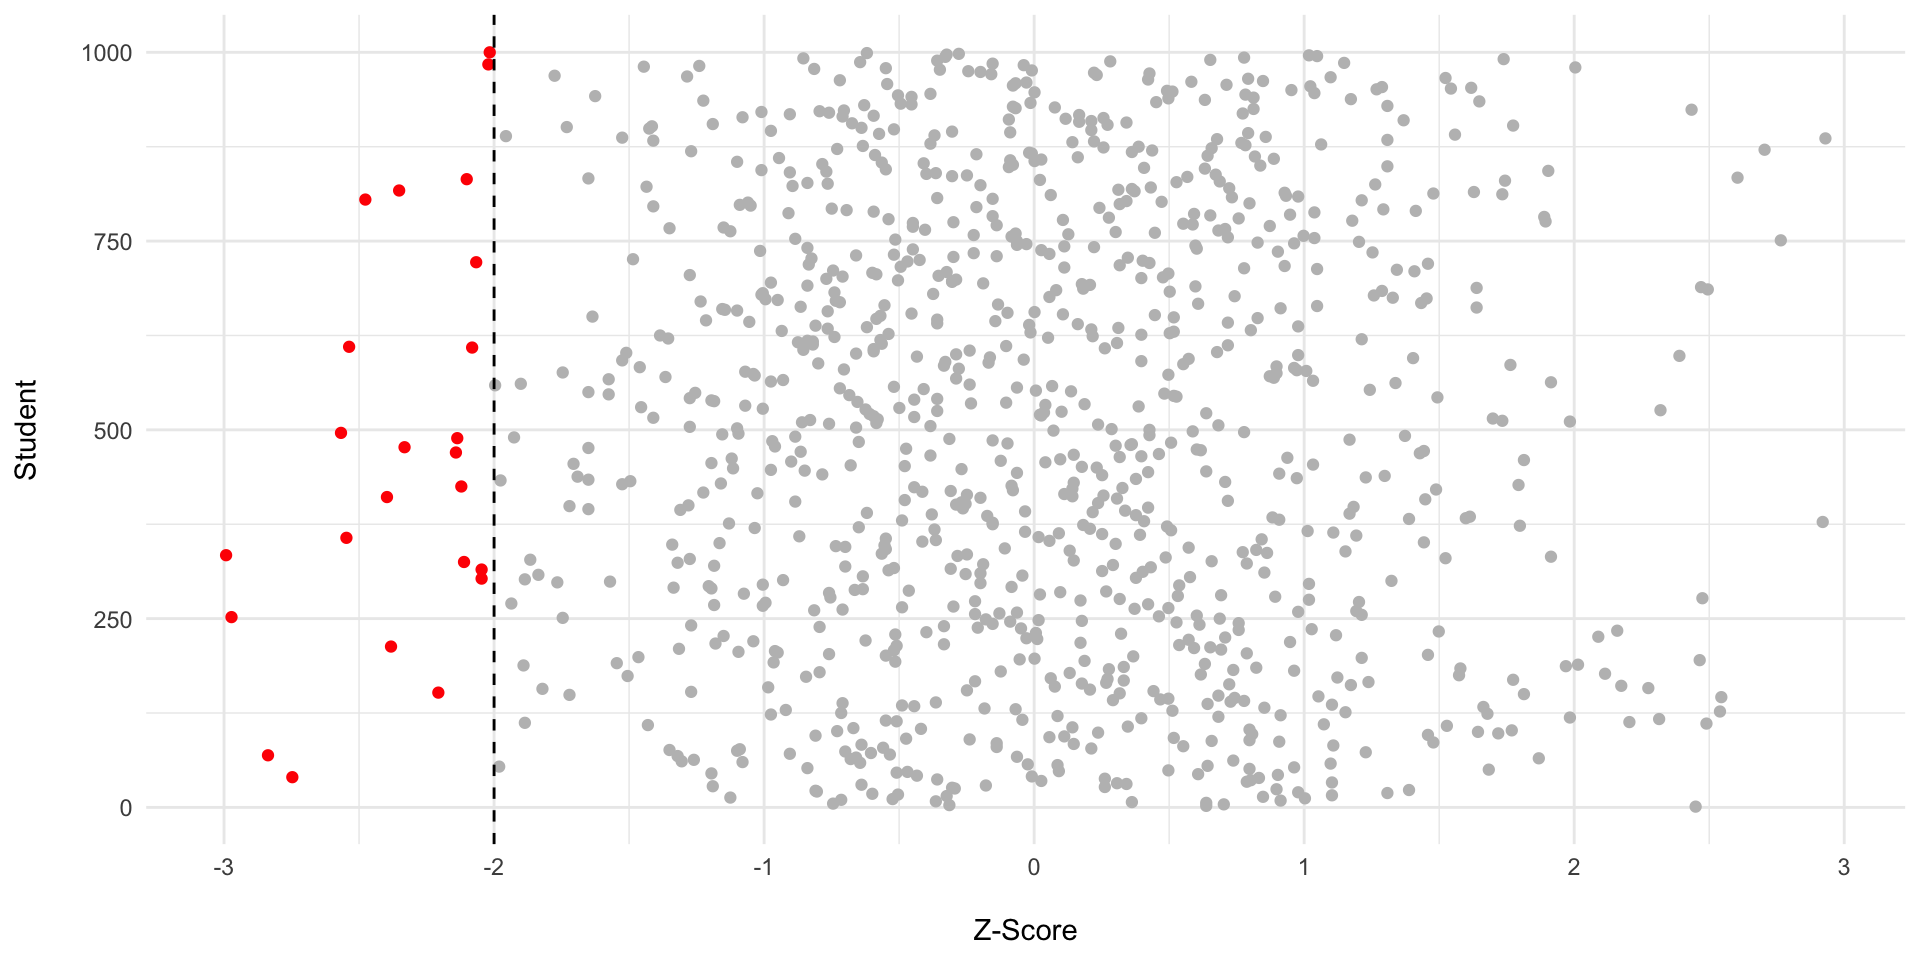
\(\frac{60-72}{6} = \frac{-12}{6} = -2\)
2.2% chance that she failed.
What’s the chance she passed?
\(100-2.2 = 97.8%\)
Z-scores and Probability
How does it apply?
In real life, we are often working with numbers with long decimal points rather than nice whole numbers.
Because the standard normal curve is standard and normal, we can calculate the exact probability of a z-score with a decimal point.
Z-scores and Probability
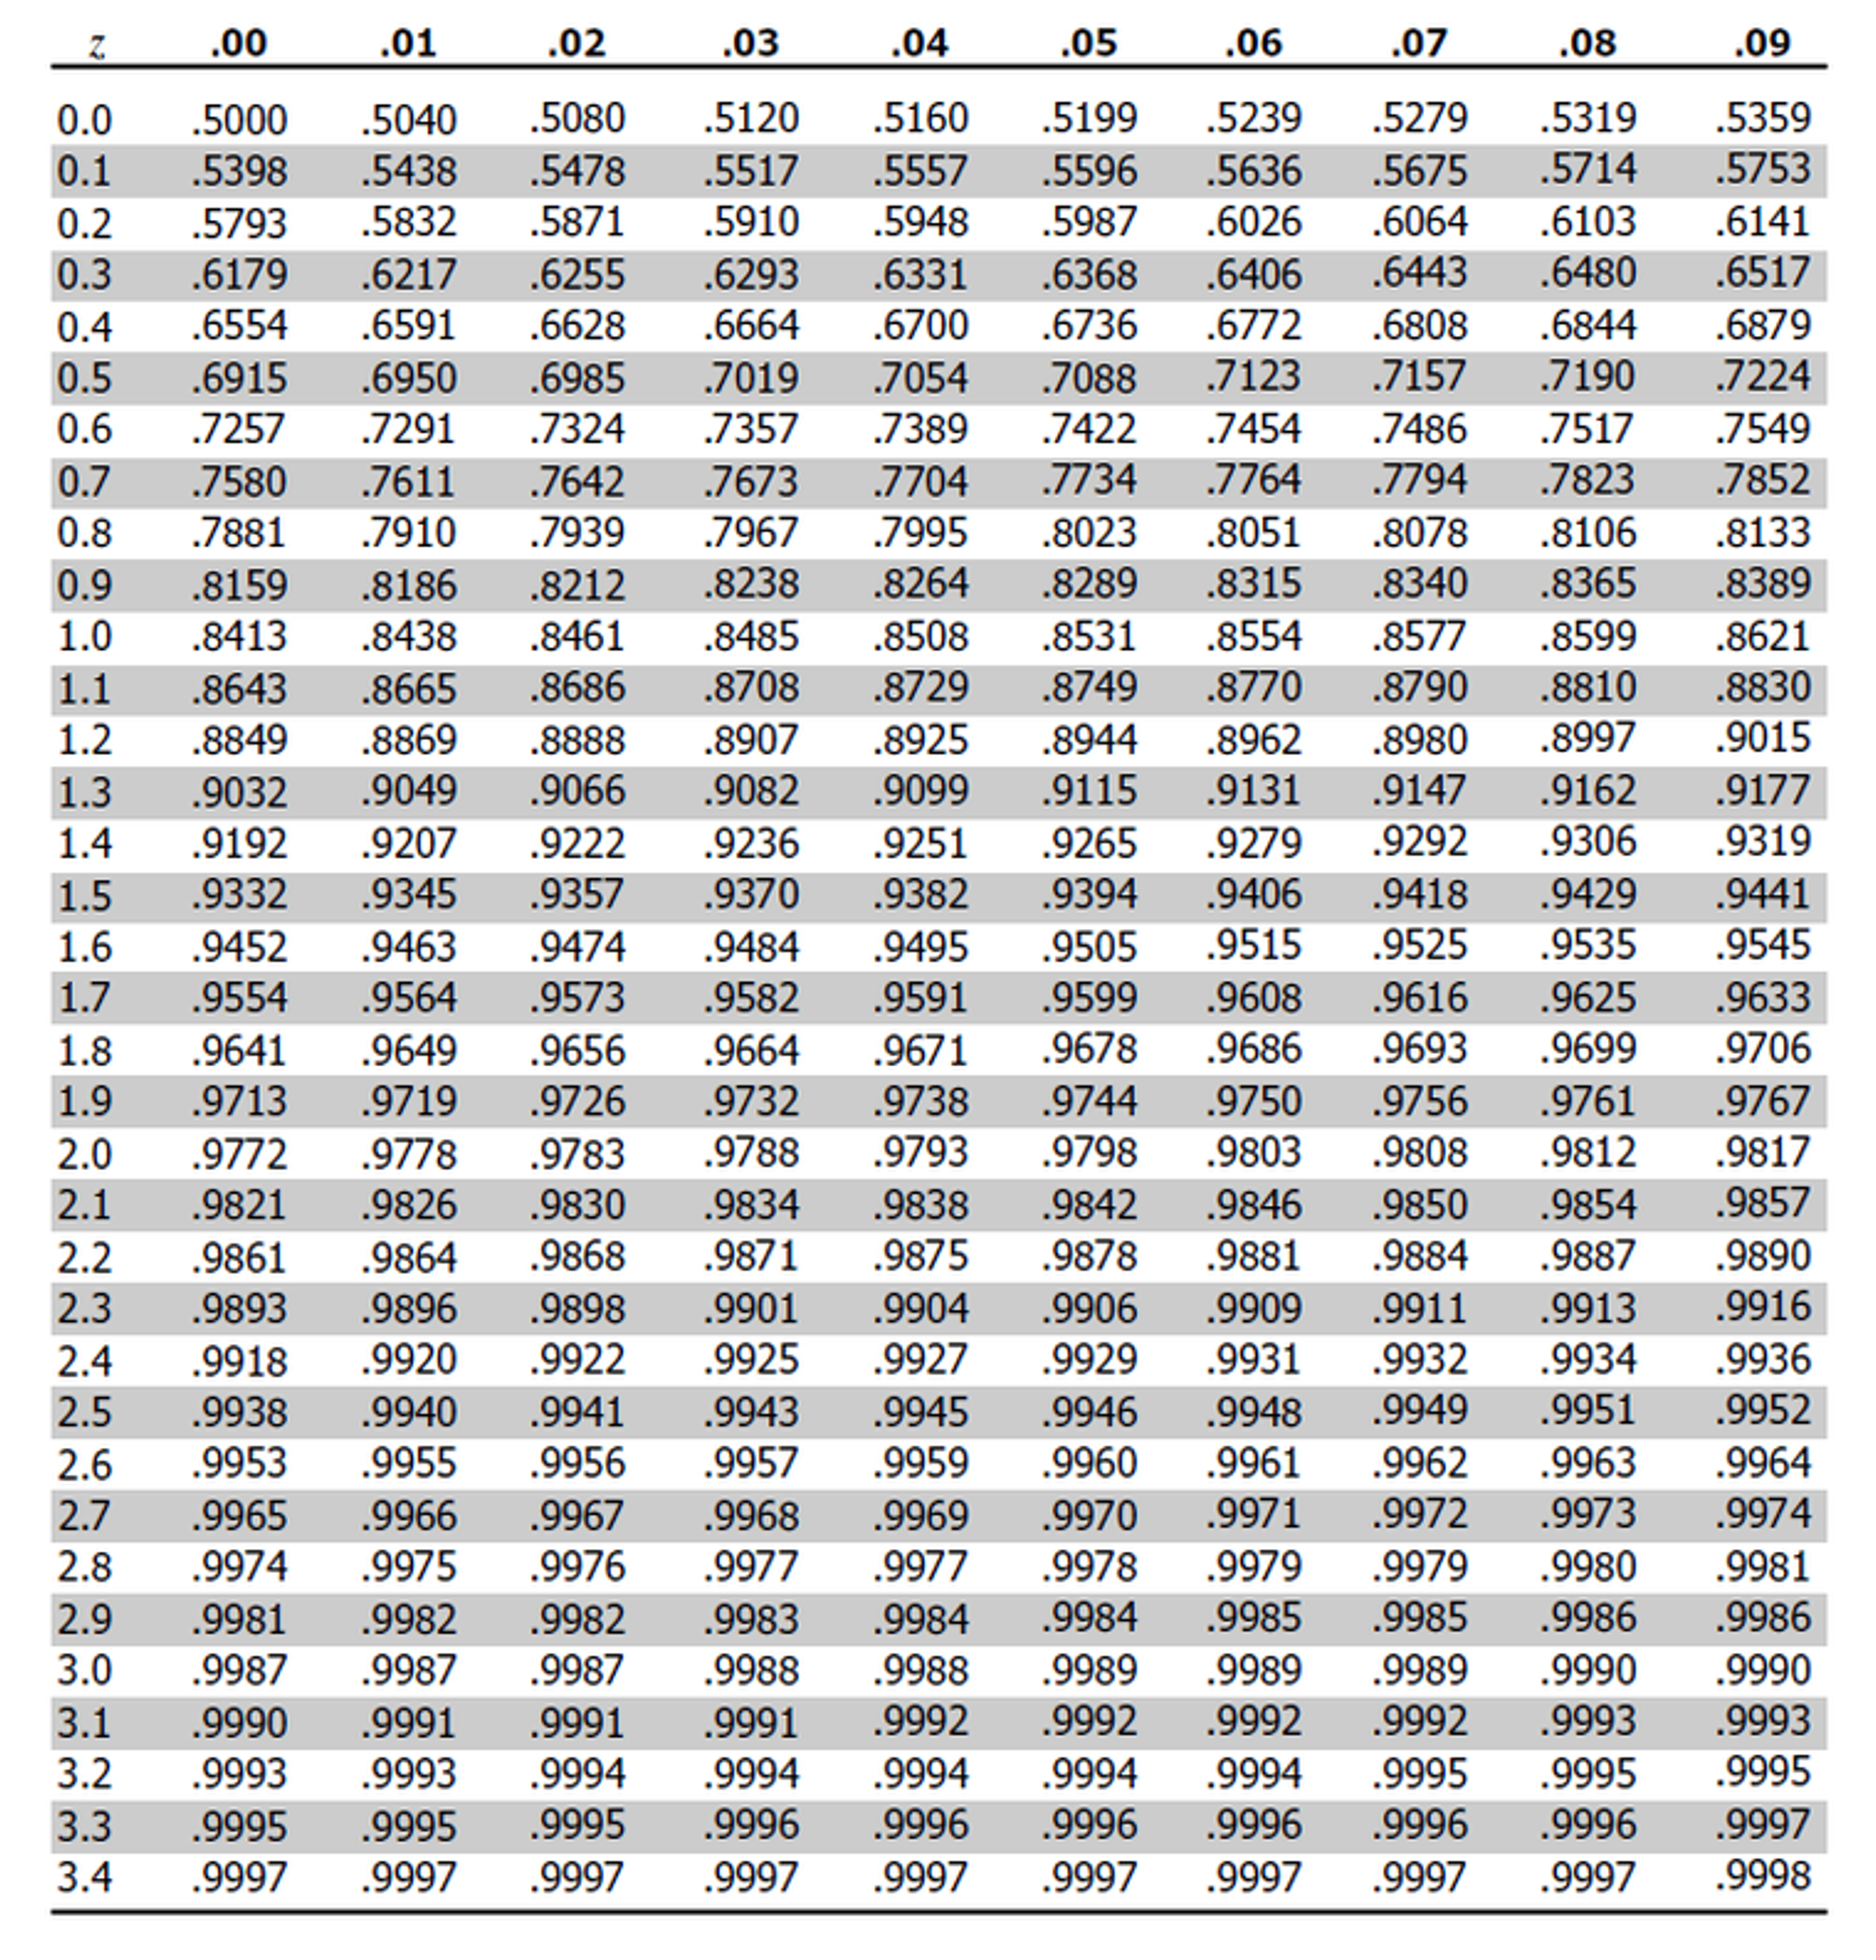
The Z-Table
Locate the whole number and first decimal point along the left side of the table.
Locate the second decimal point along the top of the table.
Z-scores and Probability
The Z-Table
The Z-score Probability Table gives you the probability of that z-score or less.
If you need that z-score or higher, you have to subtract the decimal from 1.
Esmeralda had a .022% chance of failing and and a 1-.022% chance of passing.
Z-scores and Probability:
Some examples
In a recent study on world happiness, participants were asked to evaluate their current lives on a scale from 0 to 10, where 0 represents the worst possible life and 10 represents the best possible life. The responses were normally distributed, with a mean of 5.4 and a standard deviation of 2.2. Find the probability that a randomly selected study participant’s response was:
Less than 4
More than 8
Z-scores and Probability:
Life Satisfaction: \(\bar{x} = 5.4 \text{ and } s = 2.2\)
Find the probability that a randomly selected study participant’s response was:
Since we want the value less than 4, we need to subtract 1
Report the value as a percentage (\(z\times100\))
Example 1
Step by Step
More than 8 (1.18)
Find 1.1 on the left size of the table (z column)
Find .08 column
Note where they intersect
Report the value as a percentage (\(z\times100\))
Z-scores and Probability:
Example 2
The scale of scores for an IQ test are approximately normal with mean 100 and standard deviation 15. The organization MENSA, which calls itself the “high IQ society”, requires a score of 130 or higher.
What percent of adults would qualify for membership?
Find the probability of scores more than 130
\(z = \frac{x-\bar{x}}{s} = z = \frac{130-100}{15}=\frac{30}{15} = 2\)
Example 2
MENSA: \(\bar{x}=100 \text{ and } s = 15\)
More than 130 (2)
Find 2.0 on the left size of the table (z column)
Find .00 column
Note where they intersect
Remember we are thinking about 130 or more so we have to subtract 1 from our proportion.