Z-scores

PSY 348: Lecture 5

Dave Brocker

Farmingdale State College

Standard Normal Distribution

What do we know about normal distributions?

  • They are shaped like a bell (“bell curve”).

  • They are symmetric.

  • They are unimodal.

  • The mean = median = mode.

Standard Deviation

Standard deviation is in the scale of the variable (x).
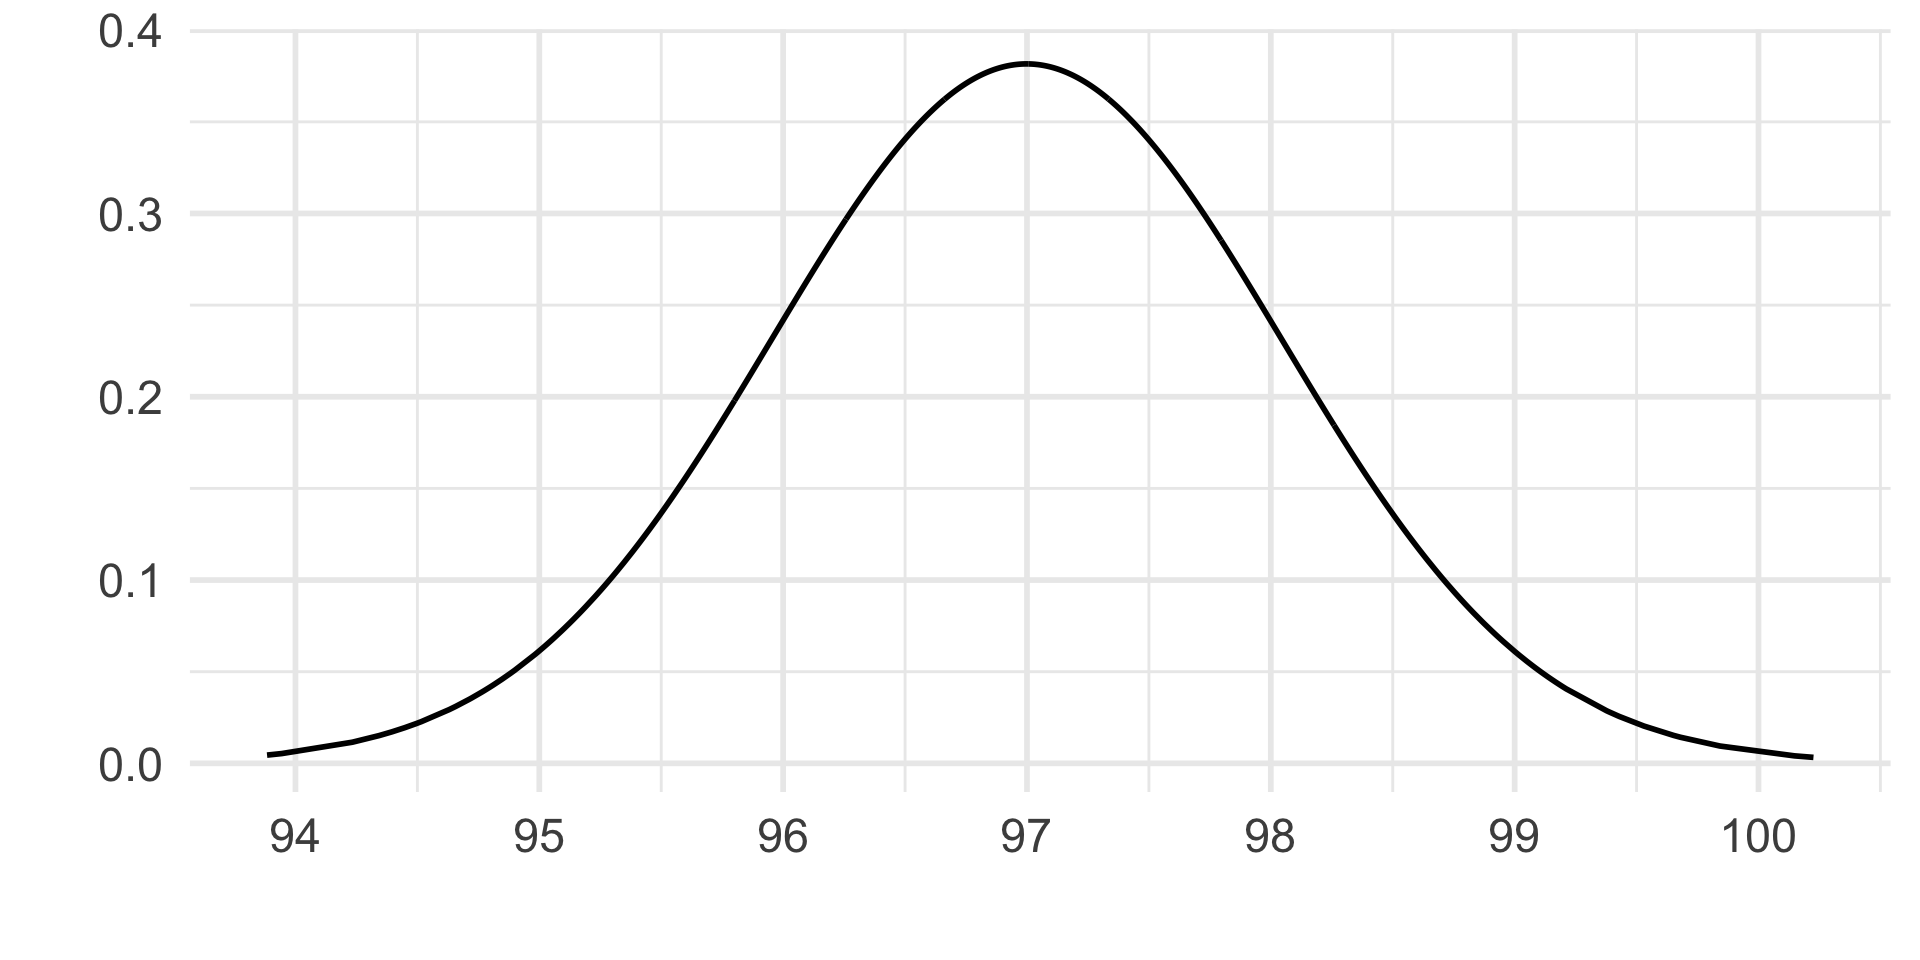
  • A standard deviation of 1 means a distance of 1 on the scale used to measure the variable.
  • Jonas scores a 98 on the exam. The average grade on the exam was 97 with a standard deviation of 1.
    • Find Jonas’ score on the normal distribution.

Standard Deviation

Standard deviation is in the scale of the variable (x).
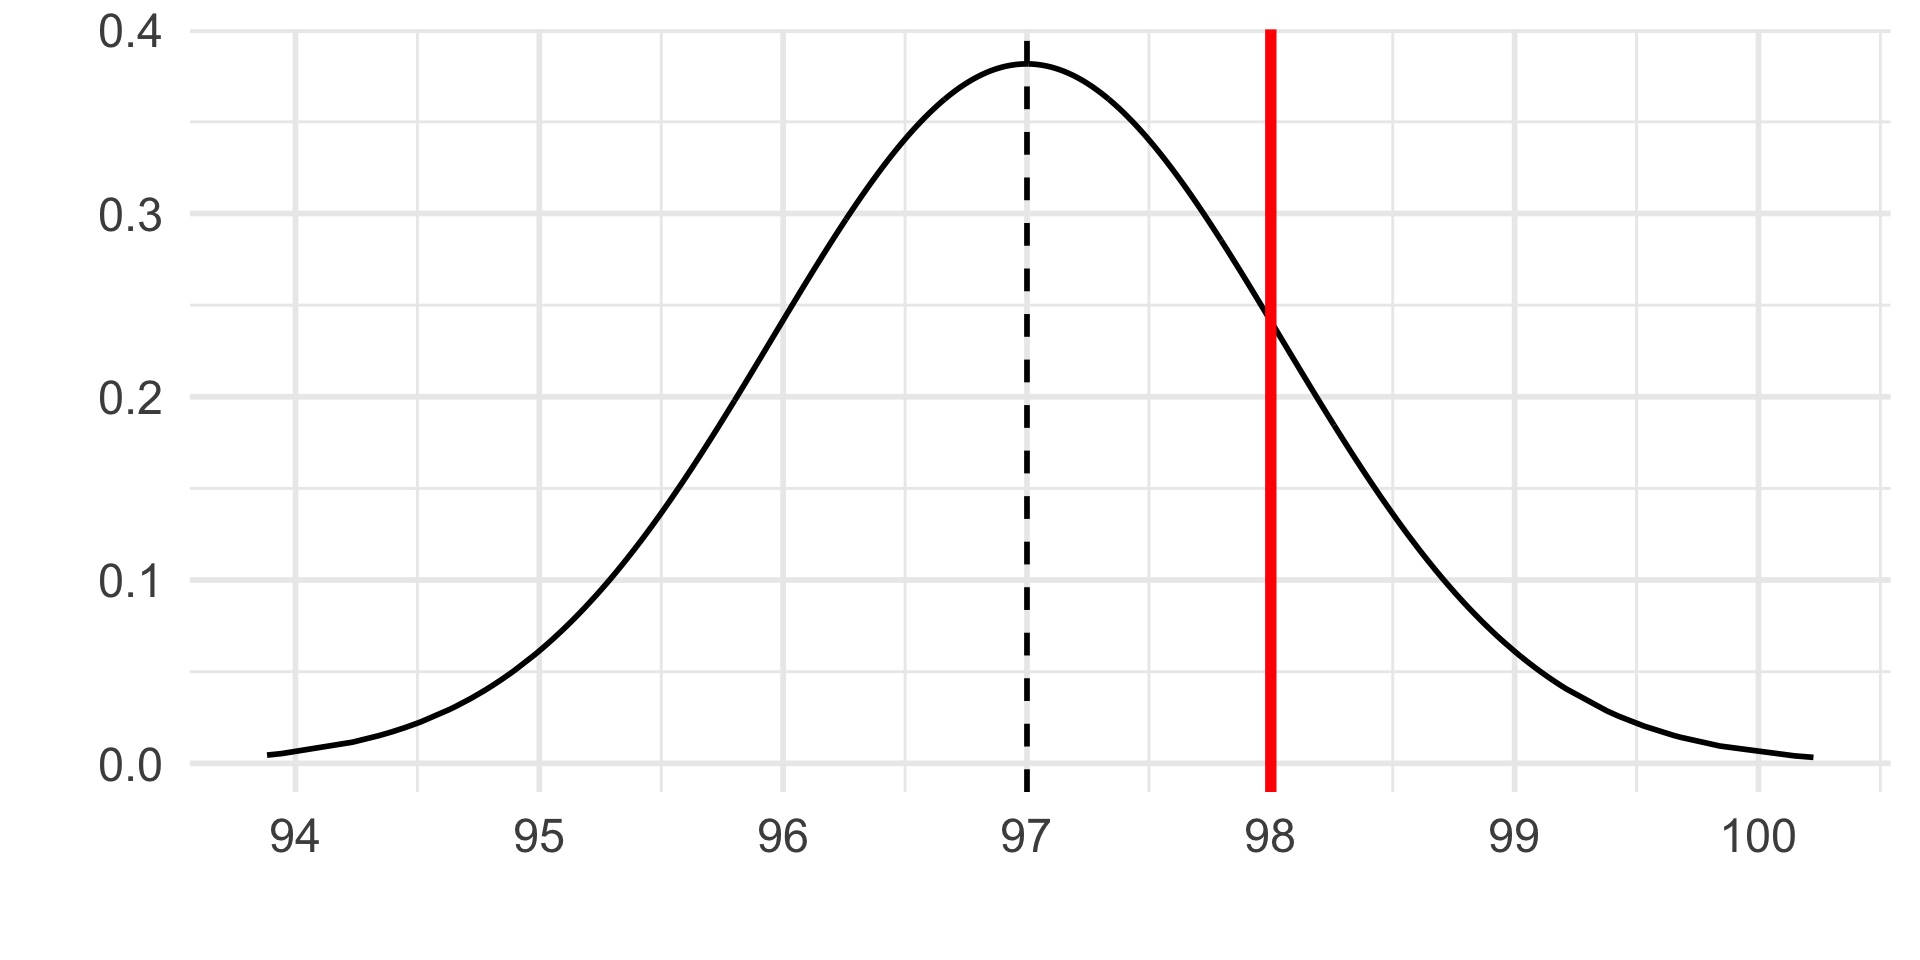
  • Jonas scores a 98 on the exam. The average grade on the exam was 97 with a standard deviation of 1.
    • Find Jonas’ score on the normal distribution.

Standard Normal Distribution

Percentages and Proportions

  • 68.3% of the data will fall within 1 SD of the mean.

  • 95.4% of the data will fall within 2 SD of the mean.

  • 99.7% of the data will fall within 3 SD of the mean.

  • “Within one standard deviation” means +1 as well as -1 standard deviation.

Standard Normal Distribution

Example 1

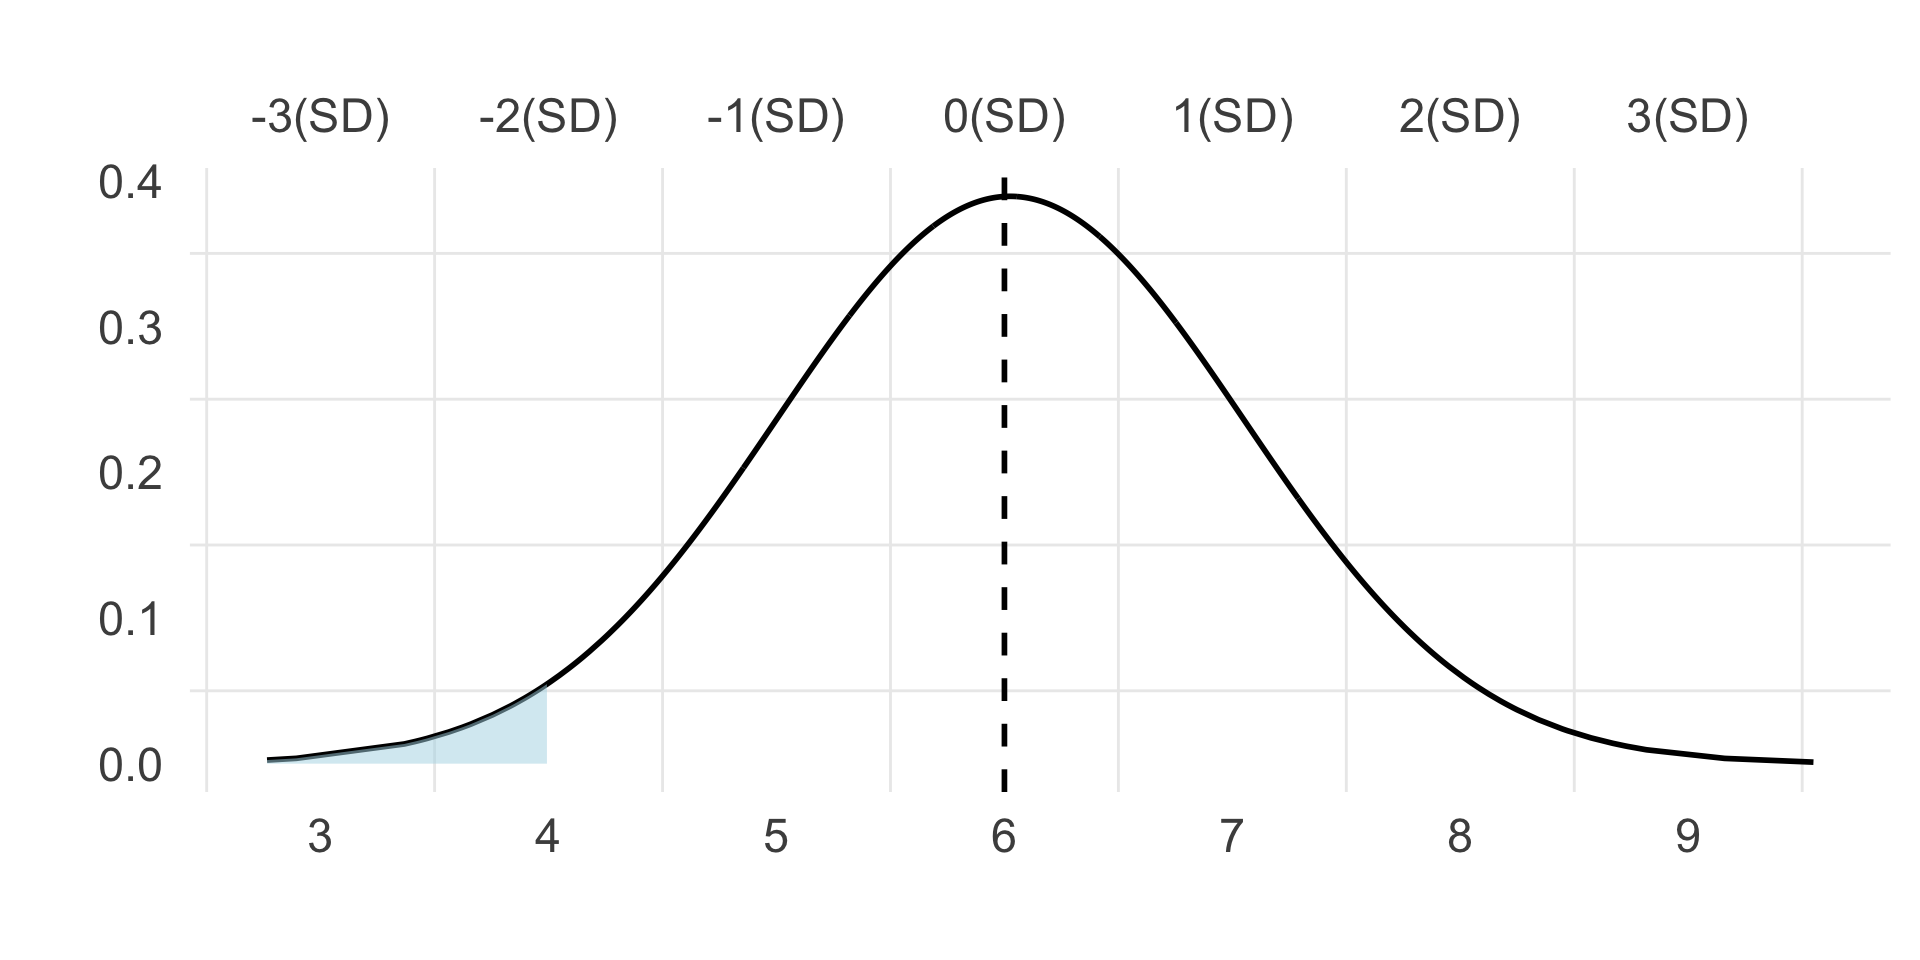
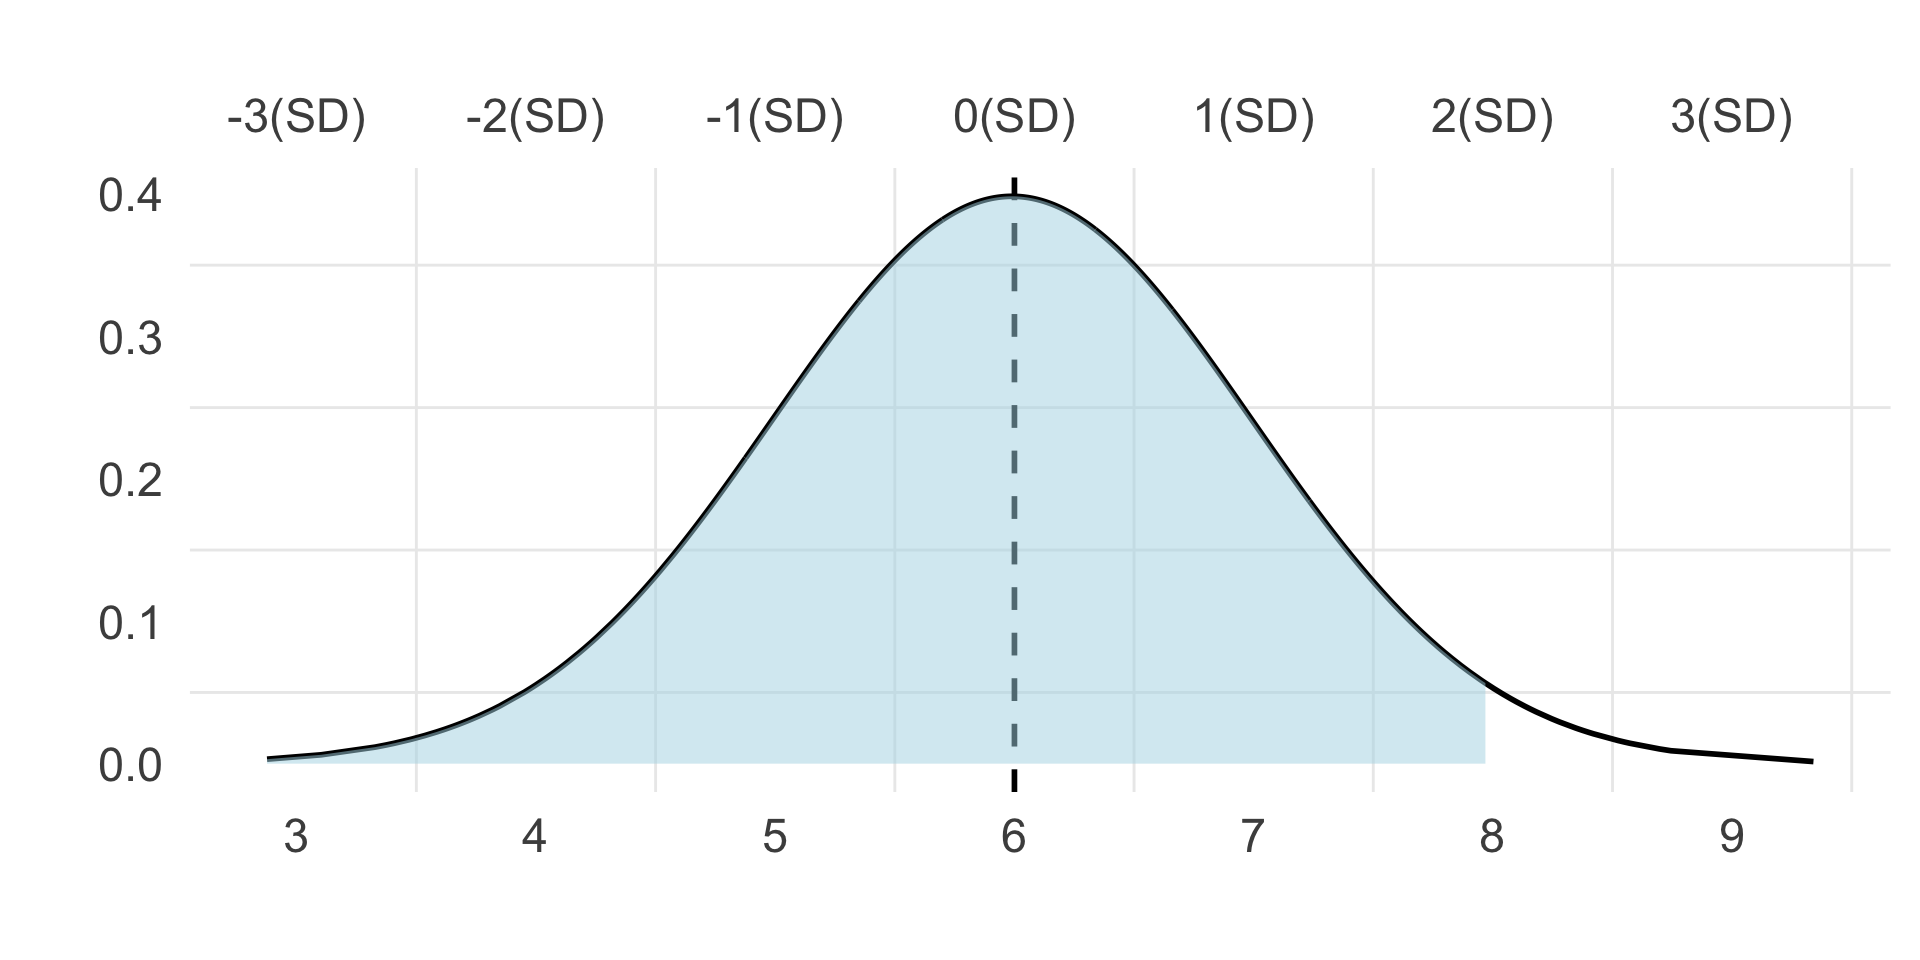
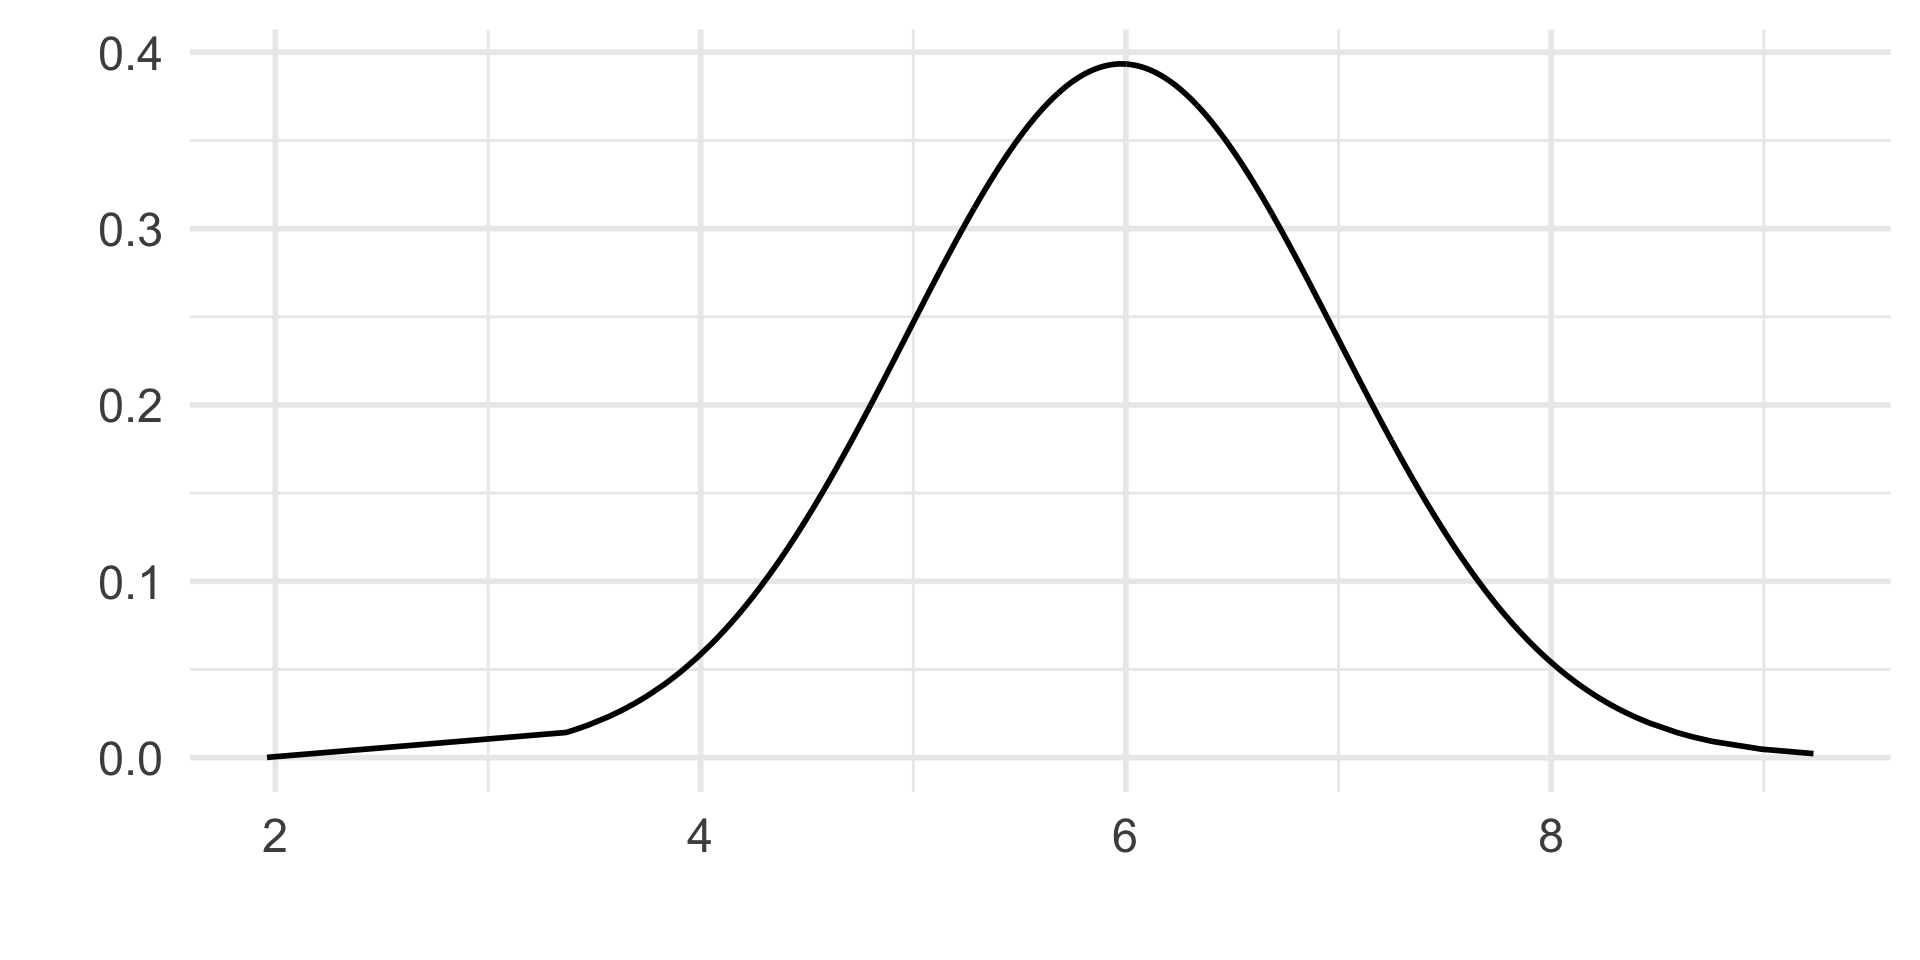
Students’ ratings of the Netflix Original Dark (range = 1- 10) form a normal distribution with m = 6 and s = 1.

  • What percentage of Students rate it a 7 or higher?

  • What percentage of Students rate it a 4 or lower?

  • What percentage of Students rate it an 8 or lower?
Standard Normal Distribution

Example 1:

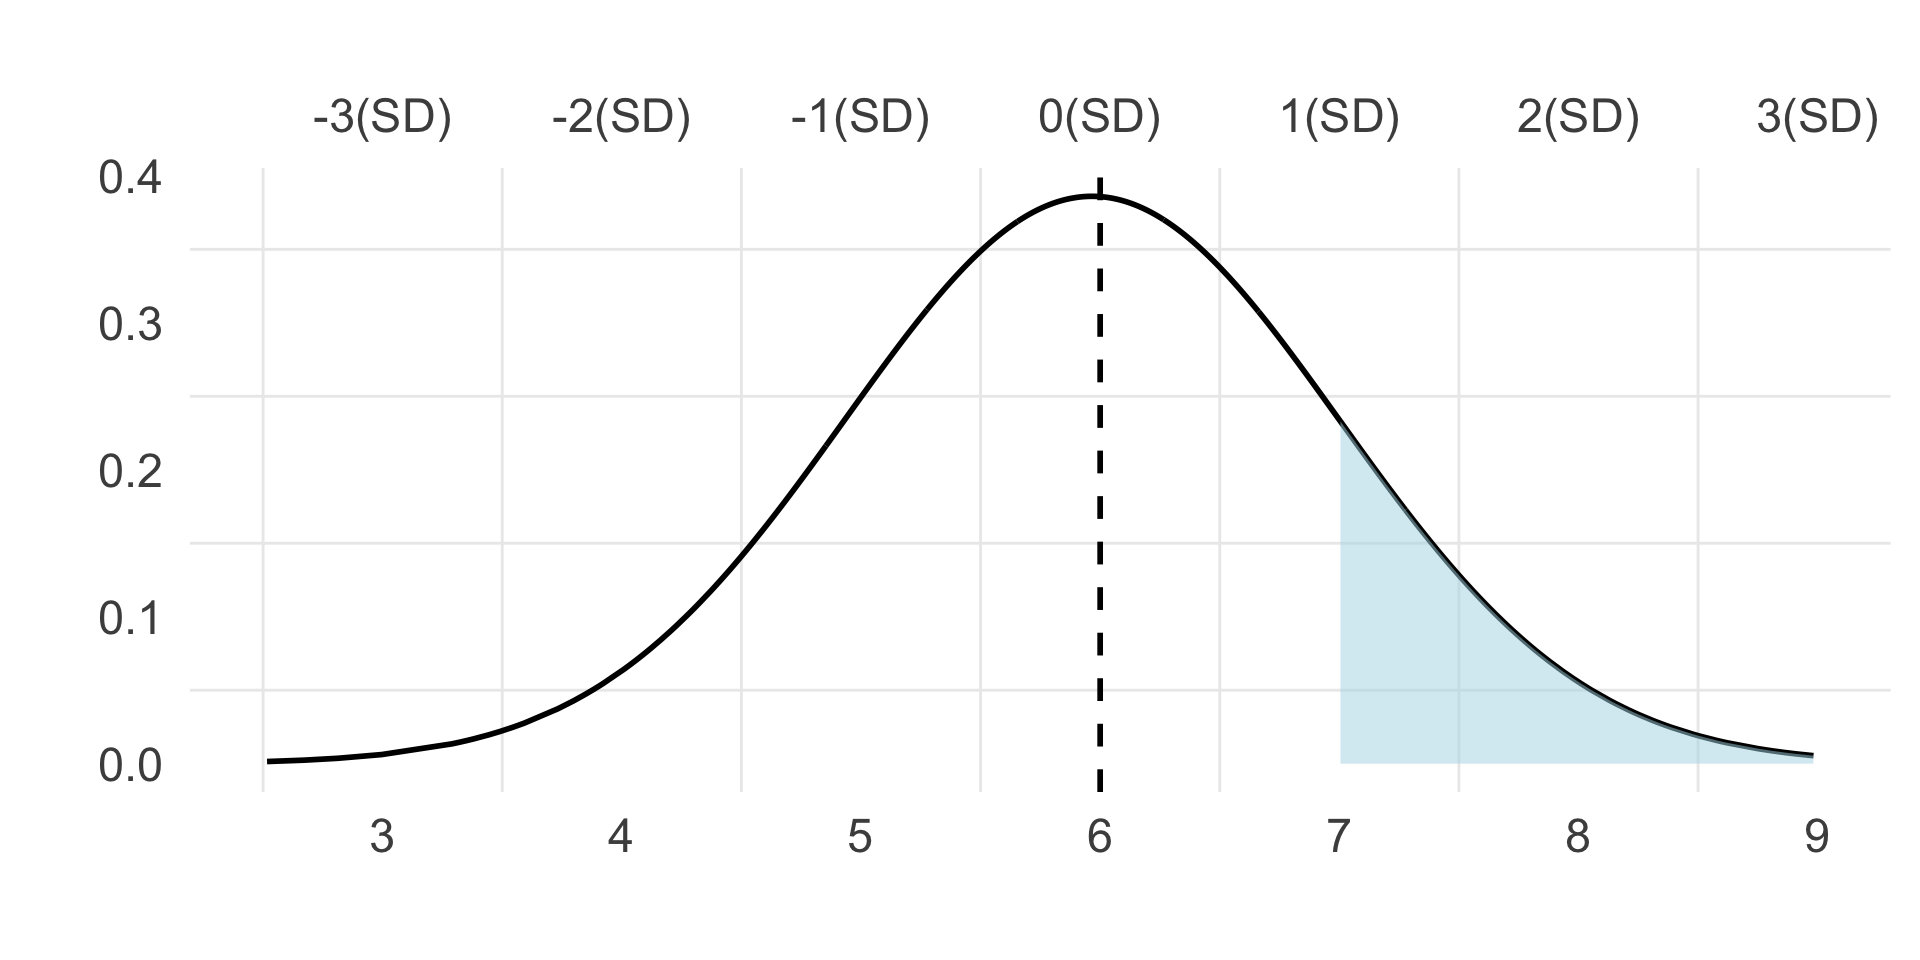
Students’ ratings of the Netflix Original Dark form a normal distribution with m = 6 and s = 1.

  • What percentage of Students rate it a 7 or higher?

  • 15.8% (13.6 [1SD] + 2.1[2SD] + .1[3SD])
Standard Normal Distribution

Example 1:

Students’ ratings of the Netflix Original Dark form a normal distribution with m = 6 and s = 1.

  • What percentage of Students rate it a 4 or lower?

  • 2.2%

Standard Normal Distribution

Example 1:

Students’ ratings of the Netflix Original Dark form a normal distribution with m = 6 and s = 1.

  • What percentage of Students rate it an 8 or lower?

  • 97.7%

Z-Scores

What does it do?

You scored an 82. Is that good?

  • You can’t say yet — good compared to what?
  • Standard deviation describes how spread out the whole group is — but only in the variable’s own units (exam points, inches, dollars…).
  • A z-score places one score on a common ruler: how many standard deviations it sits from the mean.
  • Because that ruler has no units, it can answer “compared to what?” for any measurement.

Z-Scores

Compared to what?

Aisha’s raw scores: 82 in Statistics, 70 in Research Methods. Which did she do better on?

Statistics

  • Score = 82
  • Mean = 88, SD = 4
  • \(z = \frac{82-88}{4} = -1.5\)

Research Methods

  • Score = 70
  • Mean = 60, SD = 8
  • \(z = \frac{70-60}{8} = +1.25\)

Raw scores said Statistics (82 > 70). The z-scores say Research Methods — above average there, below average in Stats. Same student, opposite story.

Z-Scores

One ruler for everything

  • A z-score is unitless — it drops the original measurement entirely.
  • So z = +2 means the same thing whether the score is in exam points, inches, or dollars: two standard deviations above average.
  • That’s what standard deviation alone can’t give you — a way to compare scores measured on completely different scales.

Z-Scores

Rule of Thumb

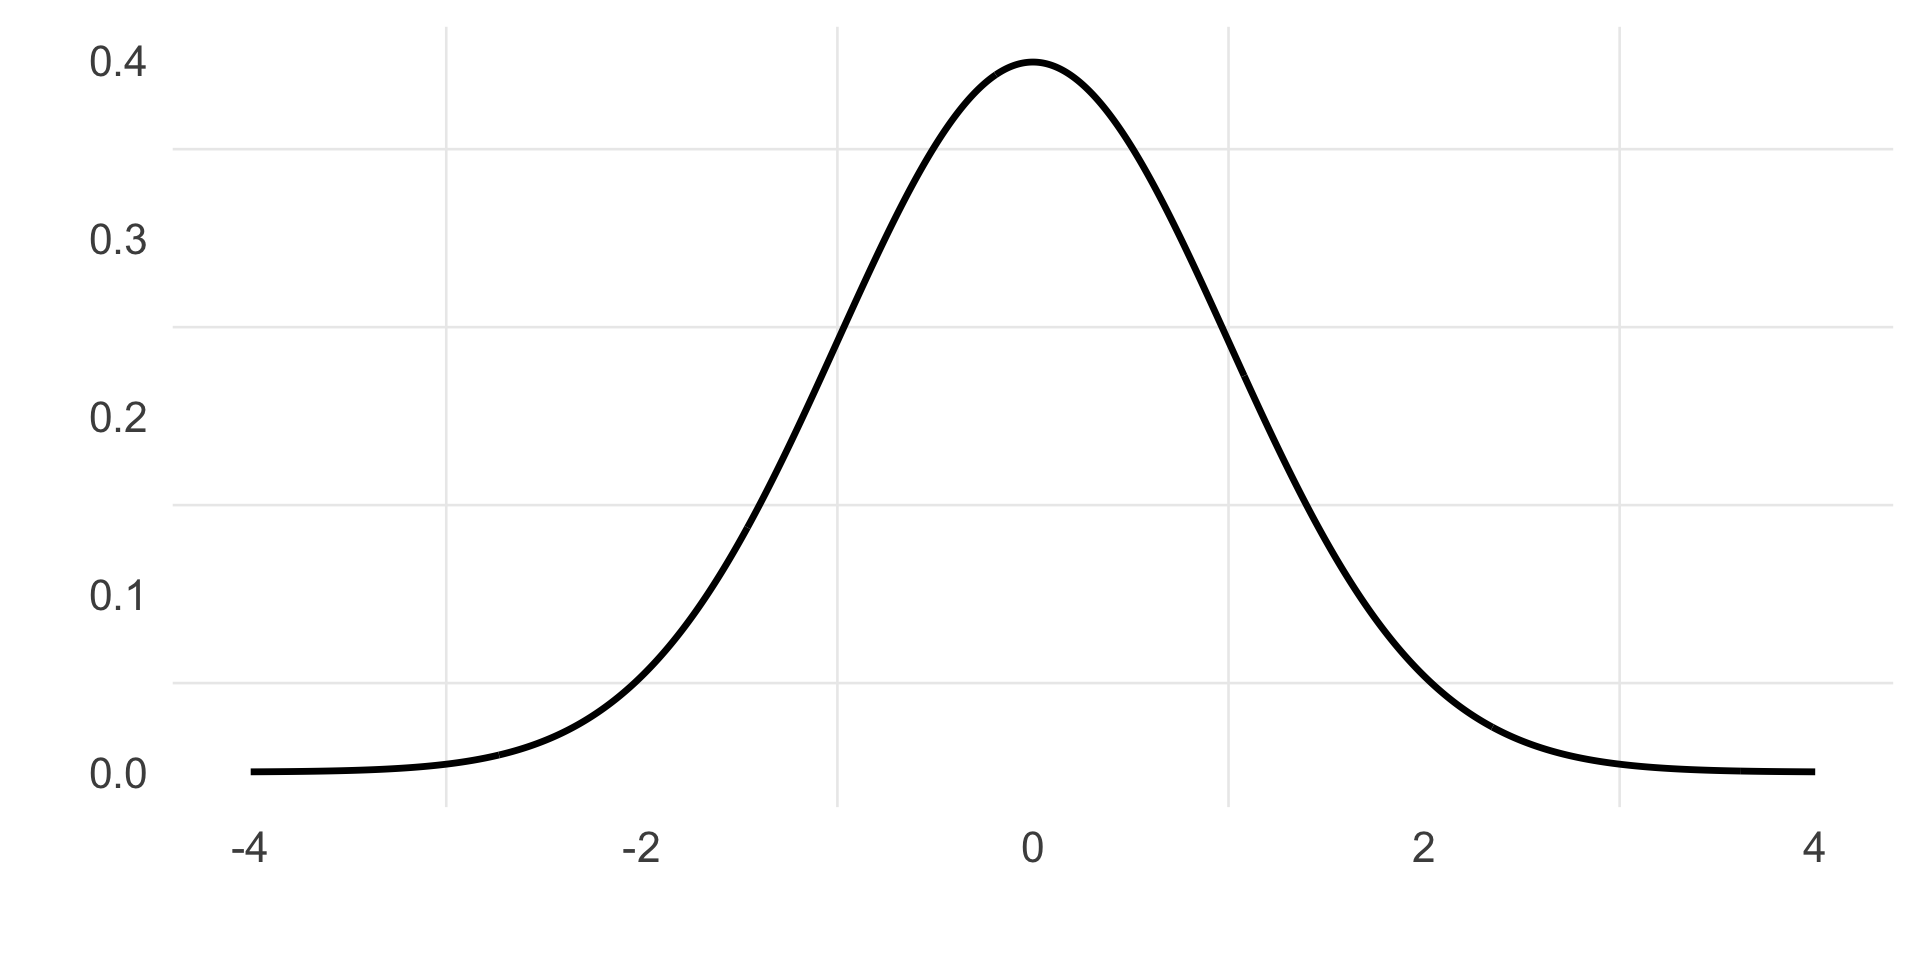
  • The distance from the mean to the 1 on this standard normal curve is equal to the SD.
  • The distance from the mean to the 1 on this standard normal curve is equal to z=1.

Z-Scores:

Find: Z = 1 | Z = -2 | Z = 0.5

Z-Scores

What do they do!

  • Z-scores re-express the original data points (the x’s) in a way that intuitively lets us know:

  • How close the x is to the mean (how much this particular participant is like the average person in the sample)

  • Where it falls in the dispersion of the distribution (how different this particular participant is from the majority of people in the sample)

Calculating

Z-scores

Formula

\[ z = \large{\frac{\color{orange}{x}-\color{red}{\bar{x}}}{\color{pink}{s}}} \]

  • Subtract the [mean]{style=“color:orange”} value from each [x]{style=“color:red”}.

  • Divide by the standard deviation

Practice Examples

Example 1

z = \(\frac{x - \mu}{\sigma}\)

  • Mean (\(\mu\)) = 50

  • Standard deviation (\(\sigma\)) = 10

  • Raw score (x) = 65

  • Find the z-score.

  • \(\frac{65-50}{10} = 1.5\)

Practice Examples

Example 2

  • Mean (\(\mu\)) = 100

  • Standard deviation (\(\sigma\)) = 15

  • Raw score (x) = 85

  • Find the z-score.

  • \(\frac{85-100}{15} = -1\)

Practice Examples

Example 3

  • Mean (\(\mu\)) = 70

  • Standard deviation (\(\sigma\)) = 8

  • Raw score (x) = 66

  • Find the z-score.

  • \(\frac{66-70}{8} = \frac{-4}{8} = -0.5\)

Practice Examples

Example 4

  • Mean (\(\mu\)) = 500

  • Standard deviation (\(\sigma\)) = 120

  • Raw score (x) = 740

  • Find the z-score.

  • \(\frac{740-500}{120} = 2\)

Practice Examples

Example 5

  • Mean (\(\mu\)) = 40

  • Standard deviation (\(\sigma\)) = 6

  • z-score = +2.5

  • Find the raw score (x).

  • \(2.5 = \frac{x-40}{6}\)

  • \(x = \mu + (z\times\sigma) = 40 + (2.5\times6) = 55\)

Z-Scores

Z-Scores are calculated by

  • Centering the X values on the mean: When we center the mean (mean-centering), we set the mean to 0.

  • Dividing by the standard deviation

  • When we divide by the SD, the space from the mean is expressed in standard deviations.

Z-Scores

A Familiar Face: \(\bar{x} = 20\)

\(x\) \(\bar{x}\) \(x-\bar{x}\) \((x-\bar{x})^2\)
10  20  −10  100 
10  20  −10  100 
20  20    0    0 
30  20   10  100 
30  20   10  100 

Z-Scores

Formula in Action

Average

\[\color{red}{\bar{x}} = \frac{\sum{x}}{n}\]

Standard Deviation

\[s = \sqrt{\frac{\sum(x-\color{red}{\bar{x}})^2}{n-1}} = \sqrt{\frac{400}{4}} = \sqrt{100} = 10\]

Z-Score

\[z =\frac{x-\color{red}{\bar{x}}}{s} = \frac{10-20}{10} = \frac{-10}{10} = -1\]

Z-Scores

\[\color{red}{\bar{x}} = \frac{\sum{x}}{n} = \frac{100}{5} = 20\]

\(x\) \(x-\bar{x}\) \((x-\bar{x})^2\) \(z=\frac{x-\bar{x}}{s}\)
10  −10  100  −1 
10  −10  100  −1 
20    0    0   0 
30   10  100   1 
30   10  100   1 
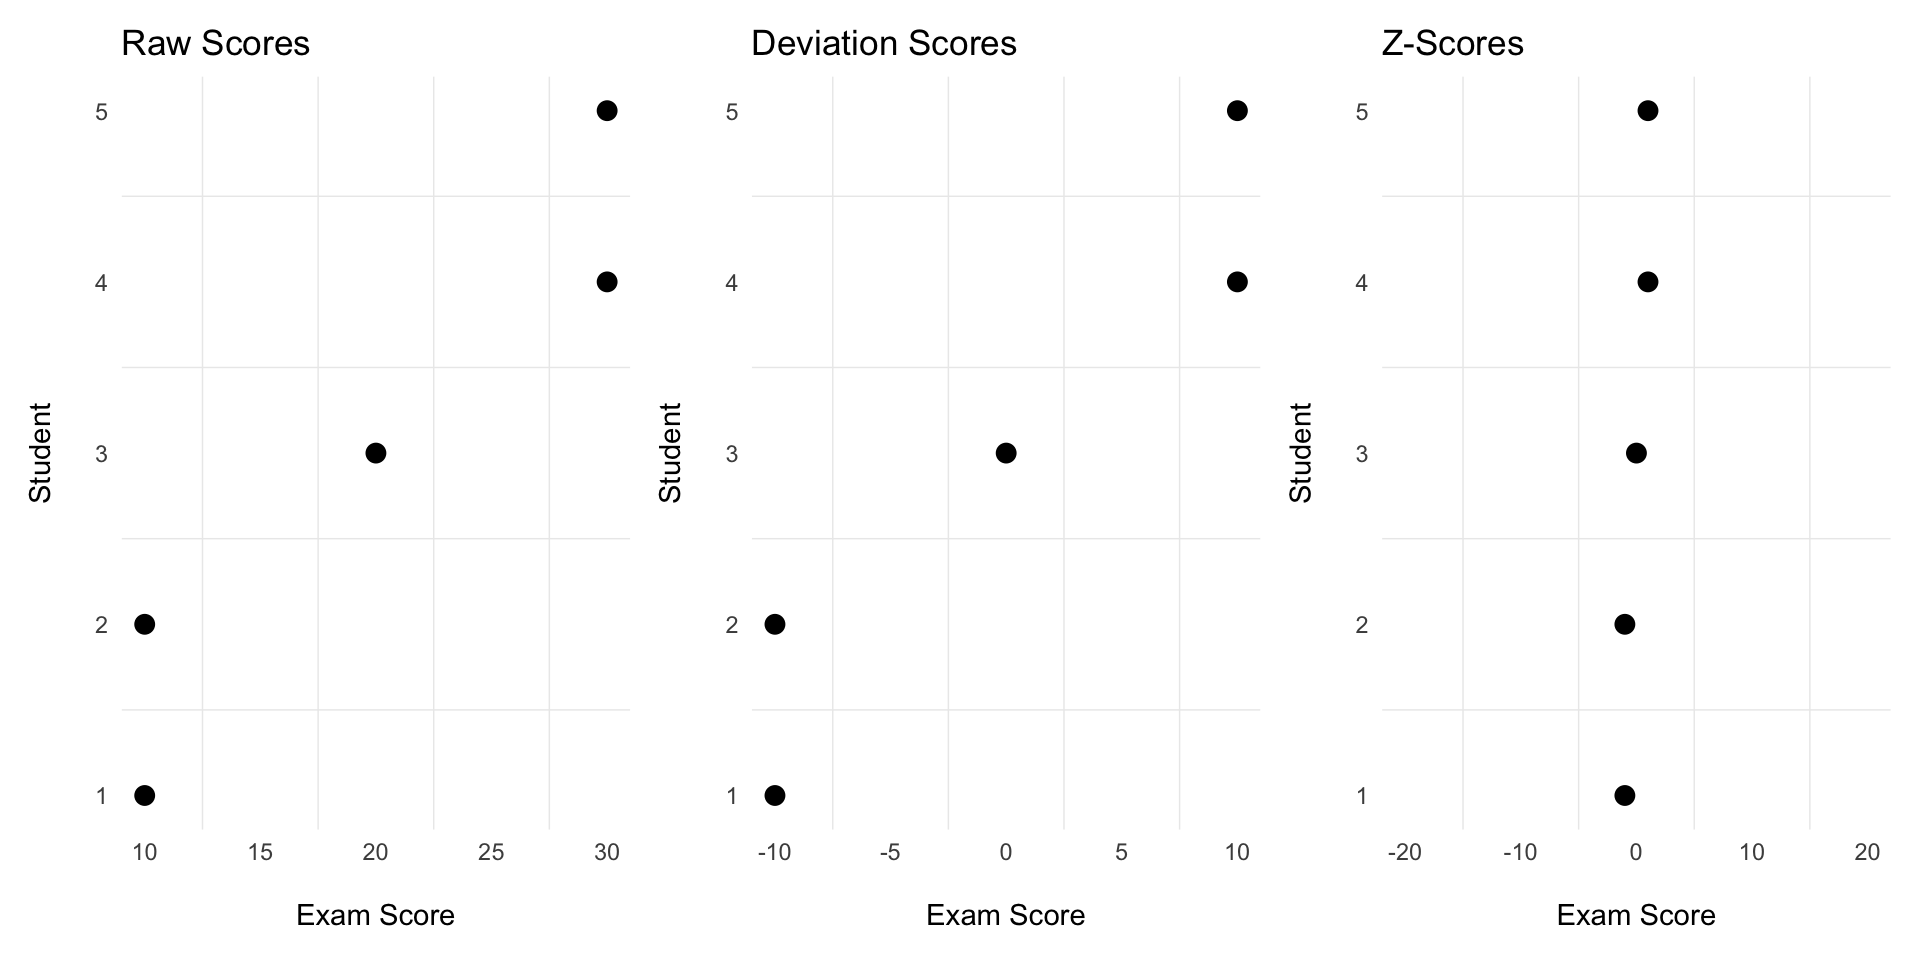
  • We made the mean = 0: When you mean-center a distribution, you shift it along the number line.

  • We made the SD = 1: When you divide a distribution by the SD, you shrink the distribution down.

  • The shape of the distribution remains the same.
Z-Scores

  • Shift distribution along the number line.

  • Shrink distribution down.

  • The shape of the distribution remains the same.

Z-Scores

Why Do We Care?

  • A z-score tells me where my score falls in SD units.

  • I can then look at this standard normal curve, and estimate what percentage of people did better or worse than me.

Z-Scores

Why Do We Care?

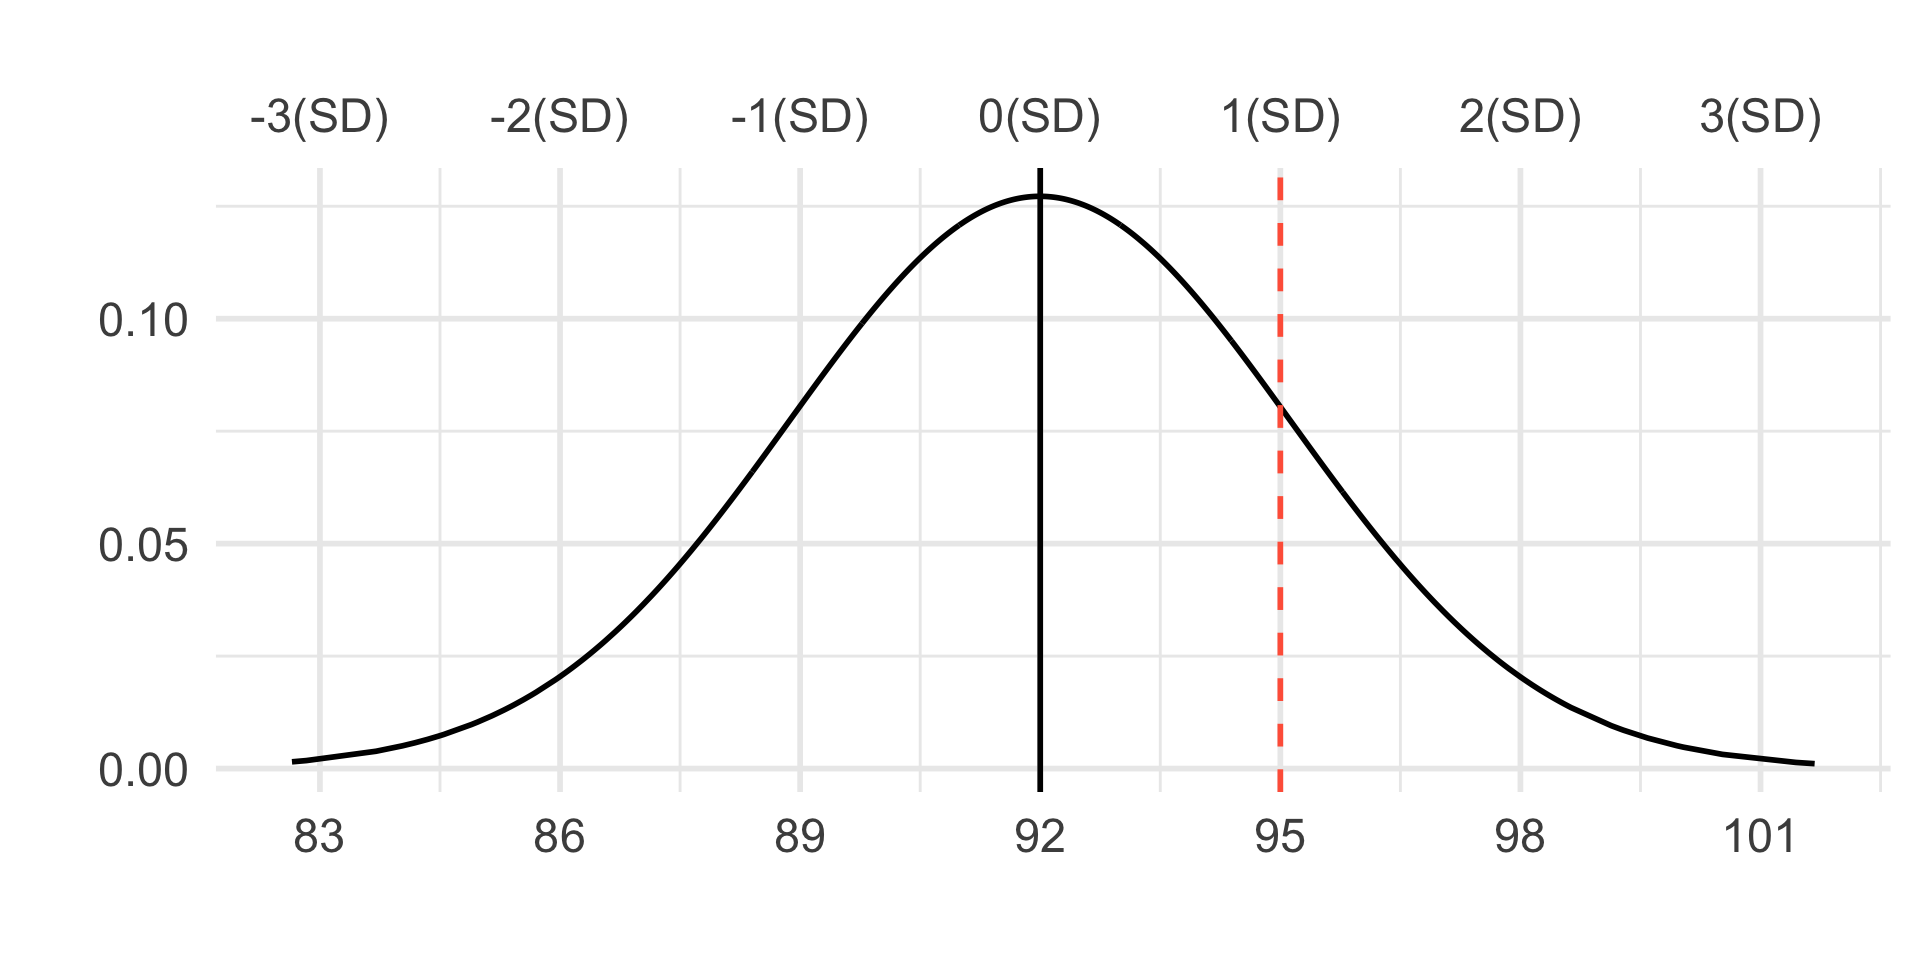
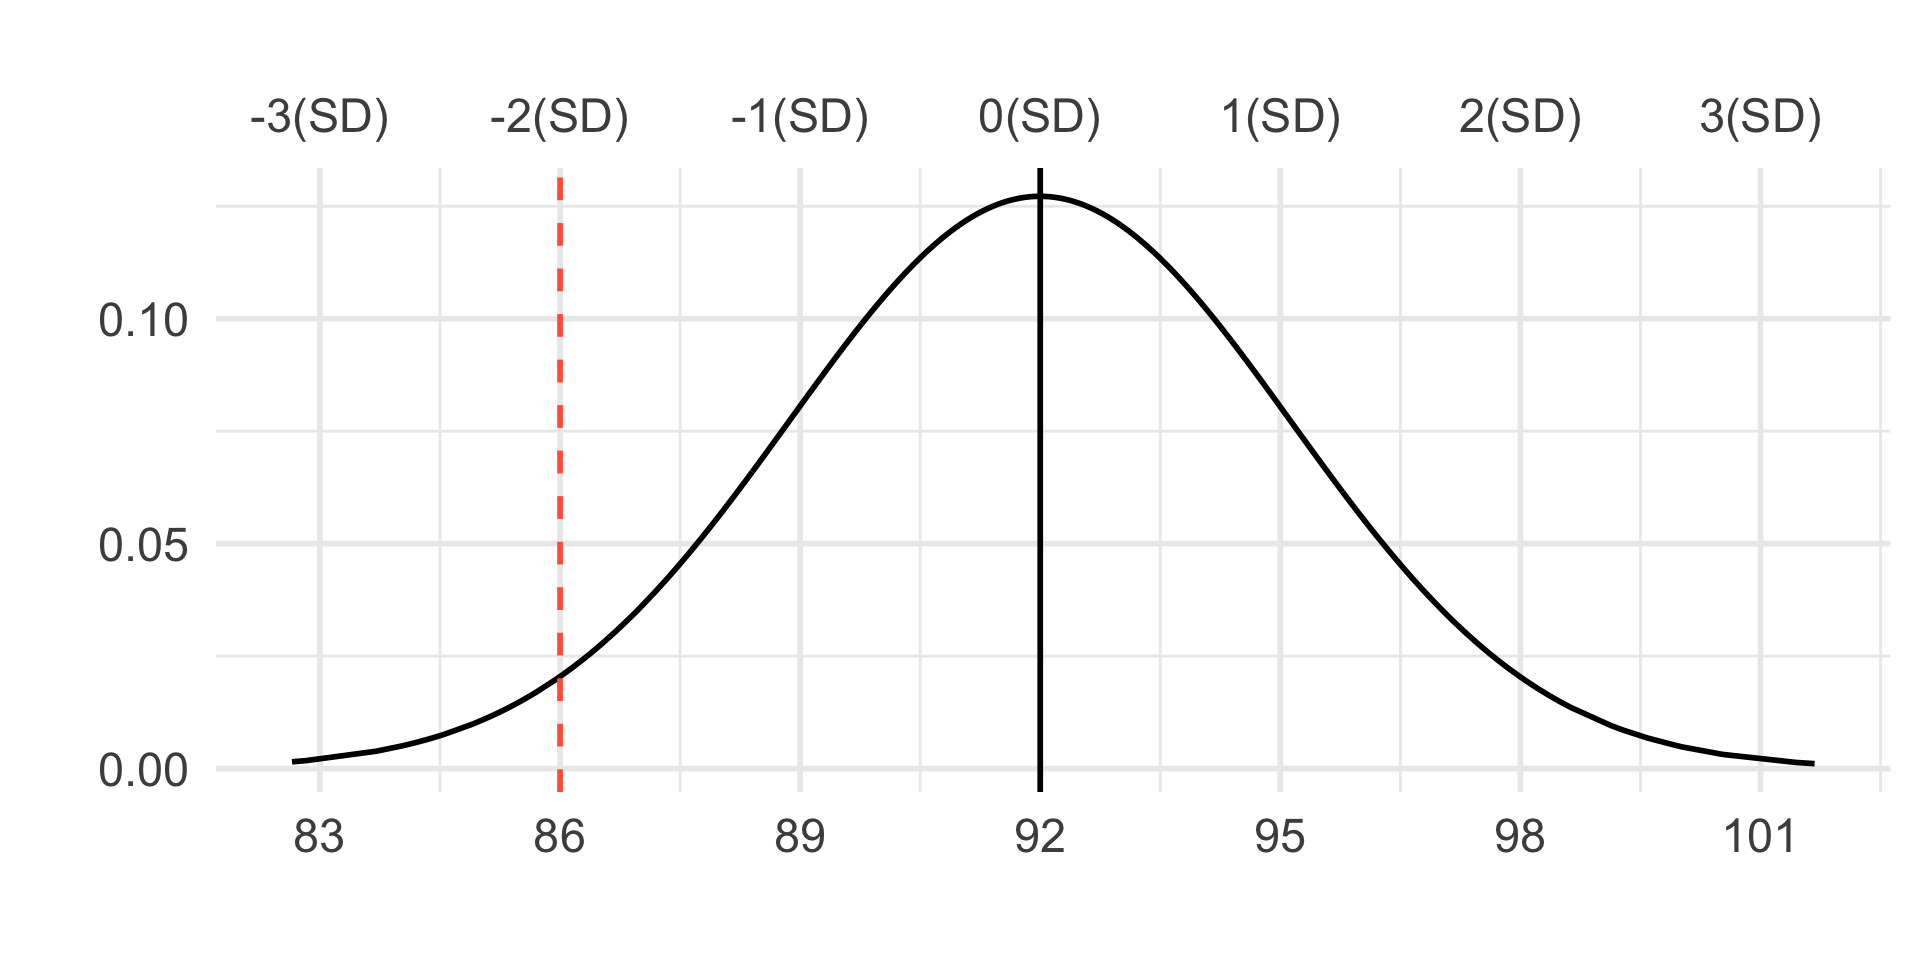
The mean score for Exam 1 was a 92 with a standard deviation of 3.

  • Esmeralda scored an 86.

  • What percent of the class scored better than Esmeralda?

  • \(z=\frac{x-\bar{x}}{s} = \frac{86-92}{3} = -2\)

  • 98% of the class did better than Esmeralda.
Z-Scores

The mean score for Exam 1 was a 92 with a standard deviation of 3.

  • Jonas scored a 95.

  • What percent of the class scored better than Jonas?

  • \(z = \frac{95-92}{3} = 1\)

  • 16% scored higher than Jonas.