Z-scores
Lecture 5
Standard Deviation
Standard deviation is in the scale of the variable (x).
- A standard deviation of 1 means a distance of 1 on the scale used to measure the variable.
- Jonas scores a
98on the exam. The average grade on the exam was97with a standard deviation of1.- Find Jonas’ score on the normal distribution.
Standard Deviation
Standard deviation is in the scale of the variable (x).

- Jonas scores a
98on the exam. The average grade on the exam was97with a standard deviation of1.- Find Jonas’ score on the normal distribution.
Standard Normal Distribution
Percentages and Proportions
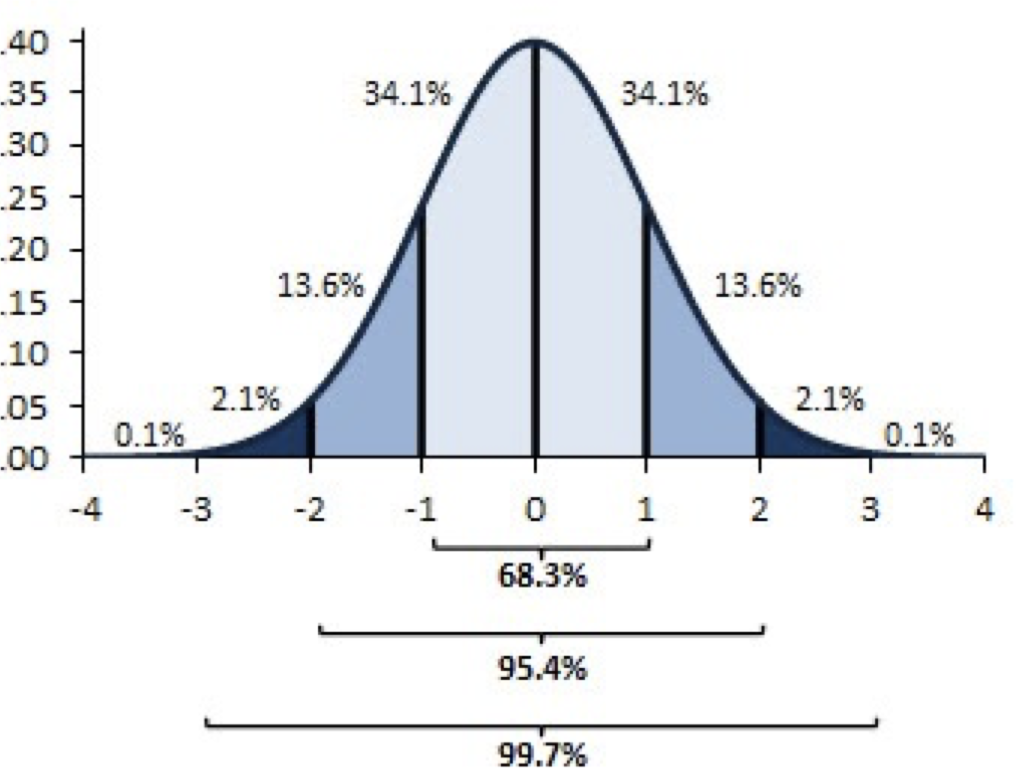
68.3% of the data will fall within 1 SD of the mean.
95.4% of the data will fall within 2 SD of the mean.
99.7% of the data will fall within 3 SD of the mean.
“Within one standard deviation” means +1 as well as -1 standard deviation.
Standard Normal Distribution
Example 1
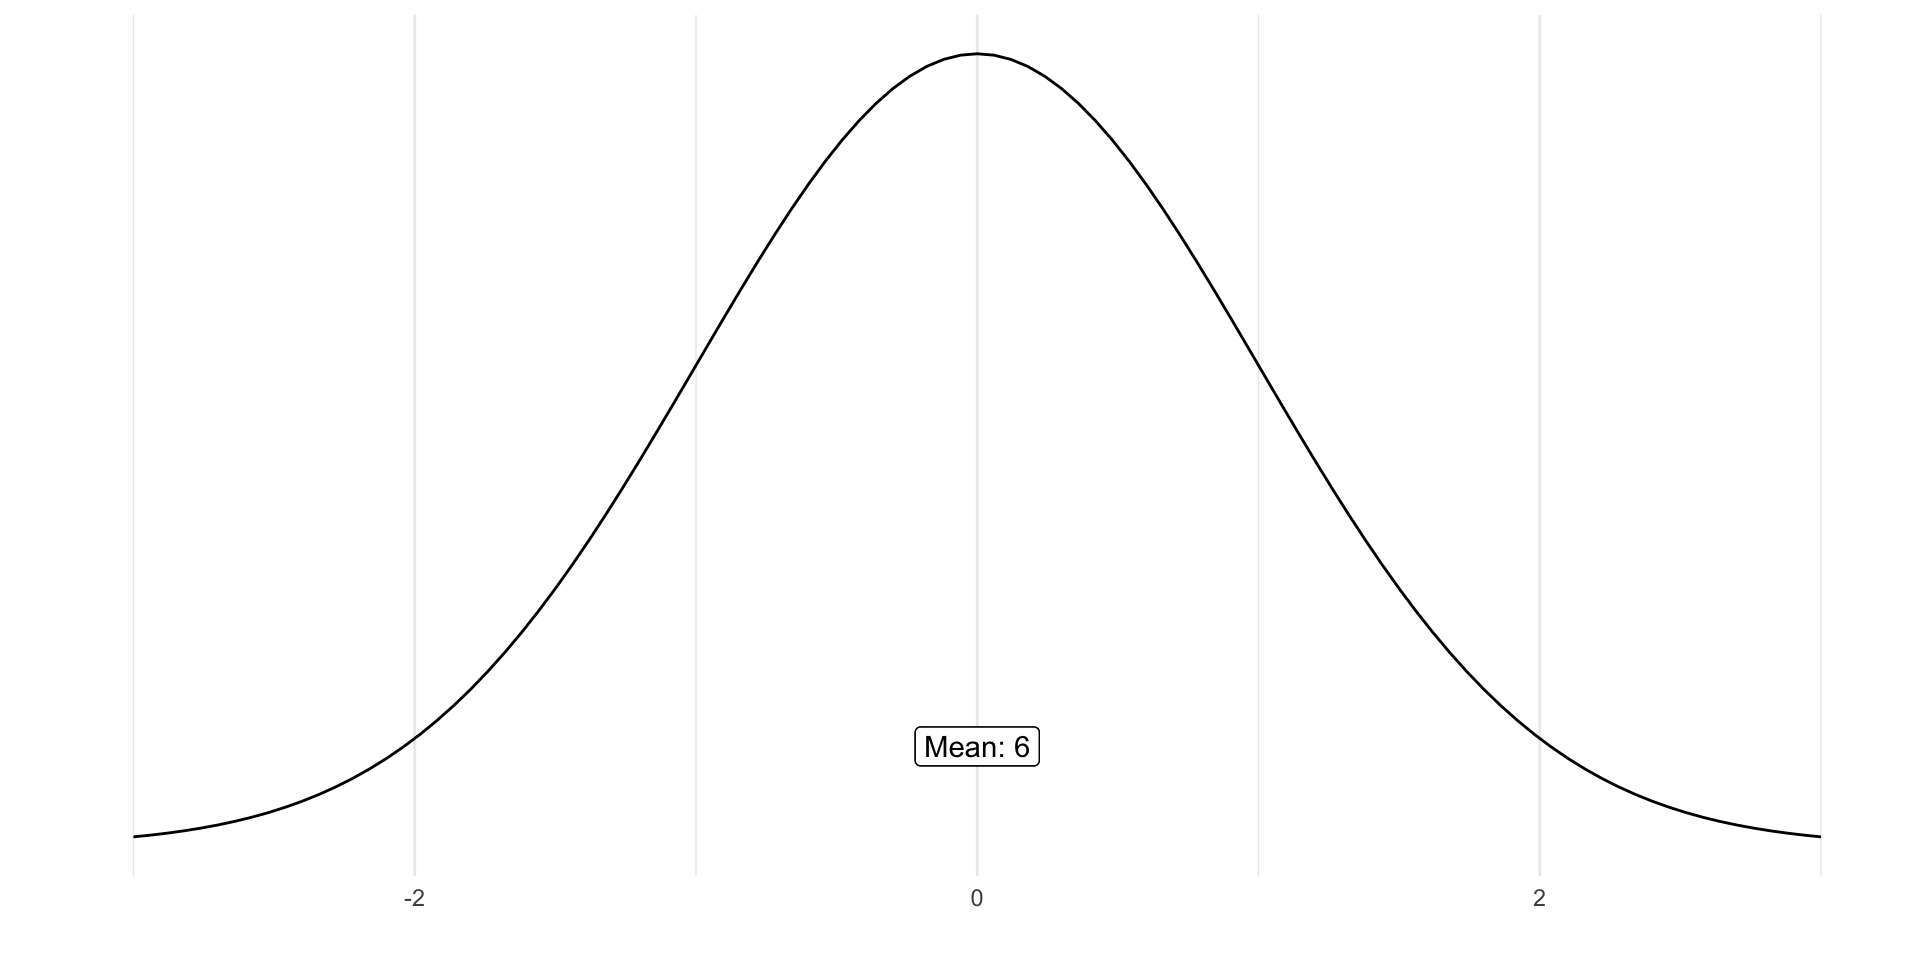
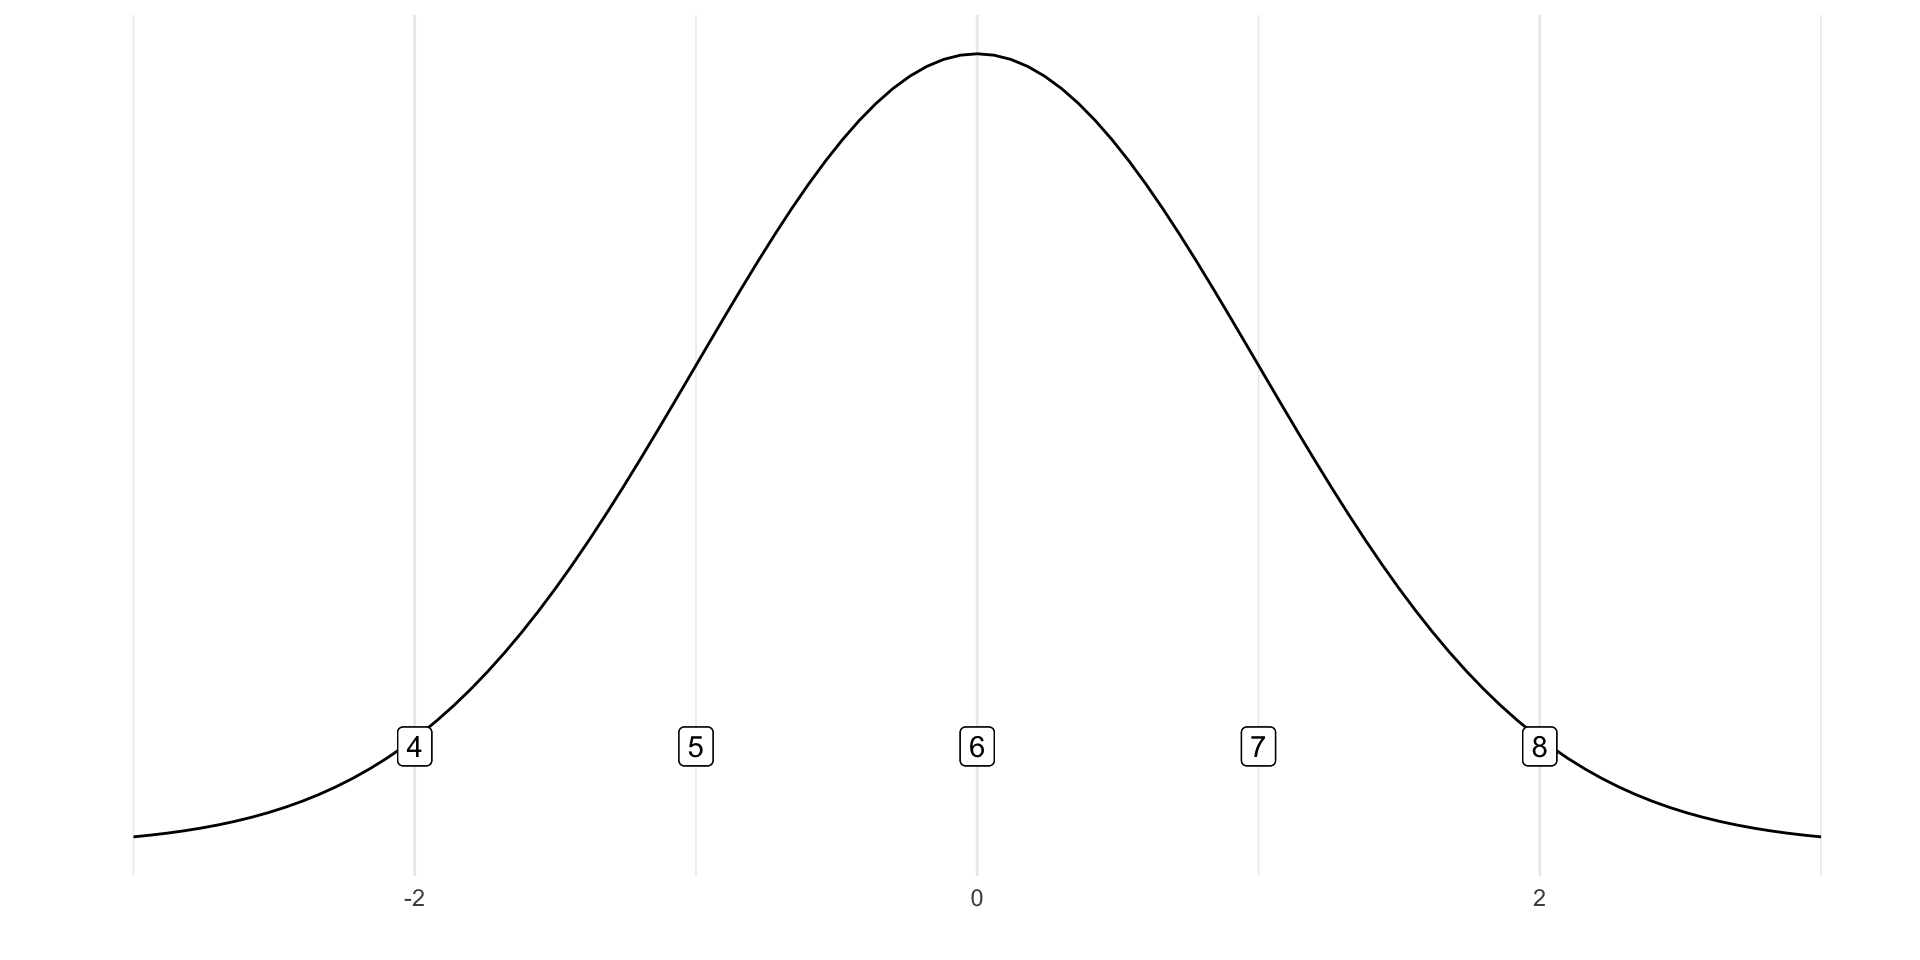
Students’ ratings of the Netflix Original Dark (range = 1- 10) form a normal distribution with m = 6 and s = 1.
What percentage of Students rate it a 7 or higher?
What percentage of Students rate it at least a 4?
What percentage of Students rate it an 8 or lower?

Standard Normal Distribution
Example 1:
Students’ ratings of the Netflix Original Dark form a normal distribution with m = 6 and s = 1.
What percentage of Students rate it a 7 or higher?
15.8% (13.6 [1SD] + 2.1[2SD] + .1[3SD])
Standard Normal Distribution
Example 1:
Students’ ratings of the Netflix Original Dark form a normal distribution with m = 6 and s = 1.
What percentage of Students rate it at least a 4?
2.2%

Standard Normal Distribution
Example 1:
Students’ ratings of the Netflix Original Dark form a normal distribution with m = 6 and s = 1.
What percentage of Students rate it an 8 or lower?
97.6%

Z-scores
Rule of Thumb
- The distance from the mean to the 1 on this standard normal curve is equal to the SD.
- The distance from the mean to the 1 on this standard normal curve is equal to z=1.
Z-scores:
Find: Z = 1 | Z = -2 | Z = 0.5
Z-scores
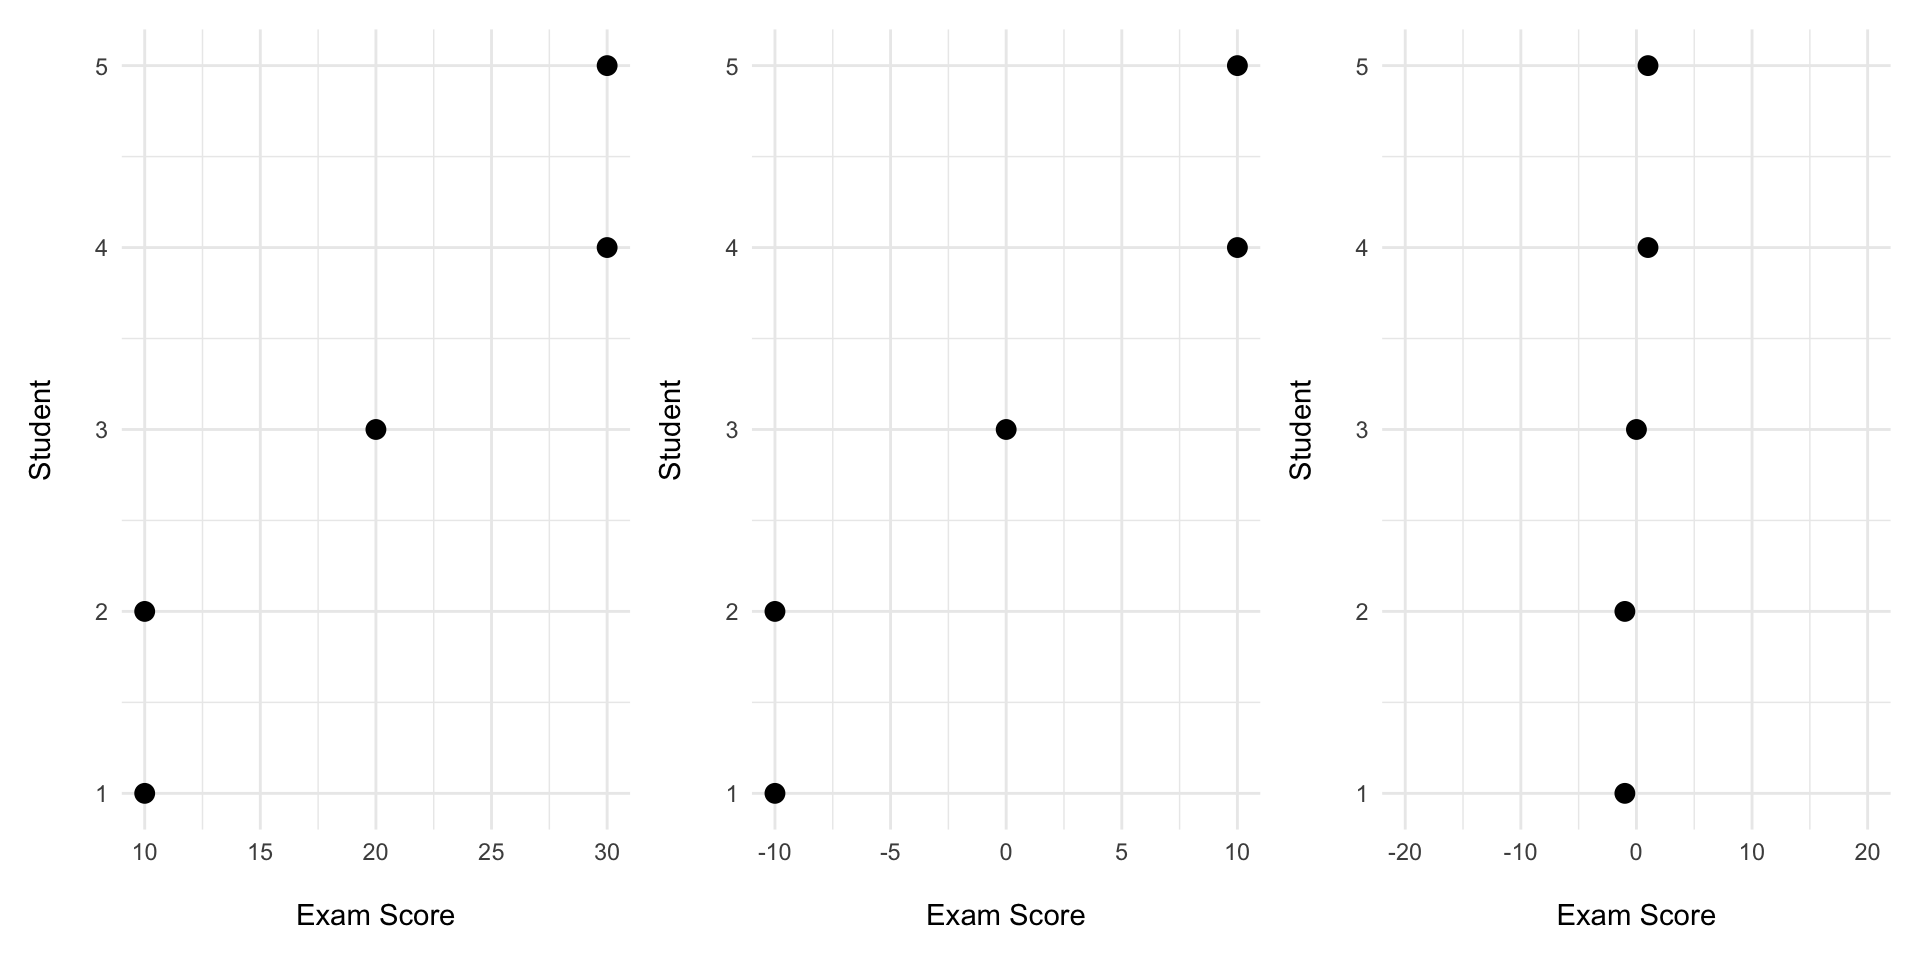
Shift distribution along the number line.
Shrink distribution down.
The shape of the distribution remains the same.

Z-Scores
Why Do We Care?
The mean score for Exam 1 was a 92 with a standard deviation of 3.
Esmeralda scored an 86.
What percent of the class scored better than Esmeralda?
\(z=\frac{x-\bar{x}}{s} = \frac{86-92}{3} = -2\)
98% of the class did better than Esmeralda.

Z-Scores
The mean score for Exam 1 was a 92 with a standard deviation of 3.
Jonas scored a 95.
What percent of the class scored better than Jonas?
\(z = \frac{95-92}{3} = 1\)
16% scored higher than Jonas.

NULL