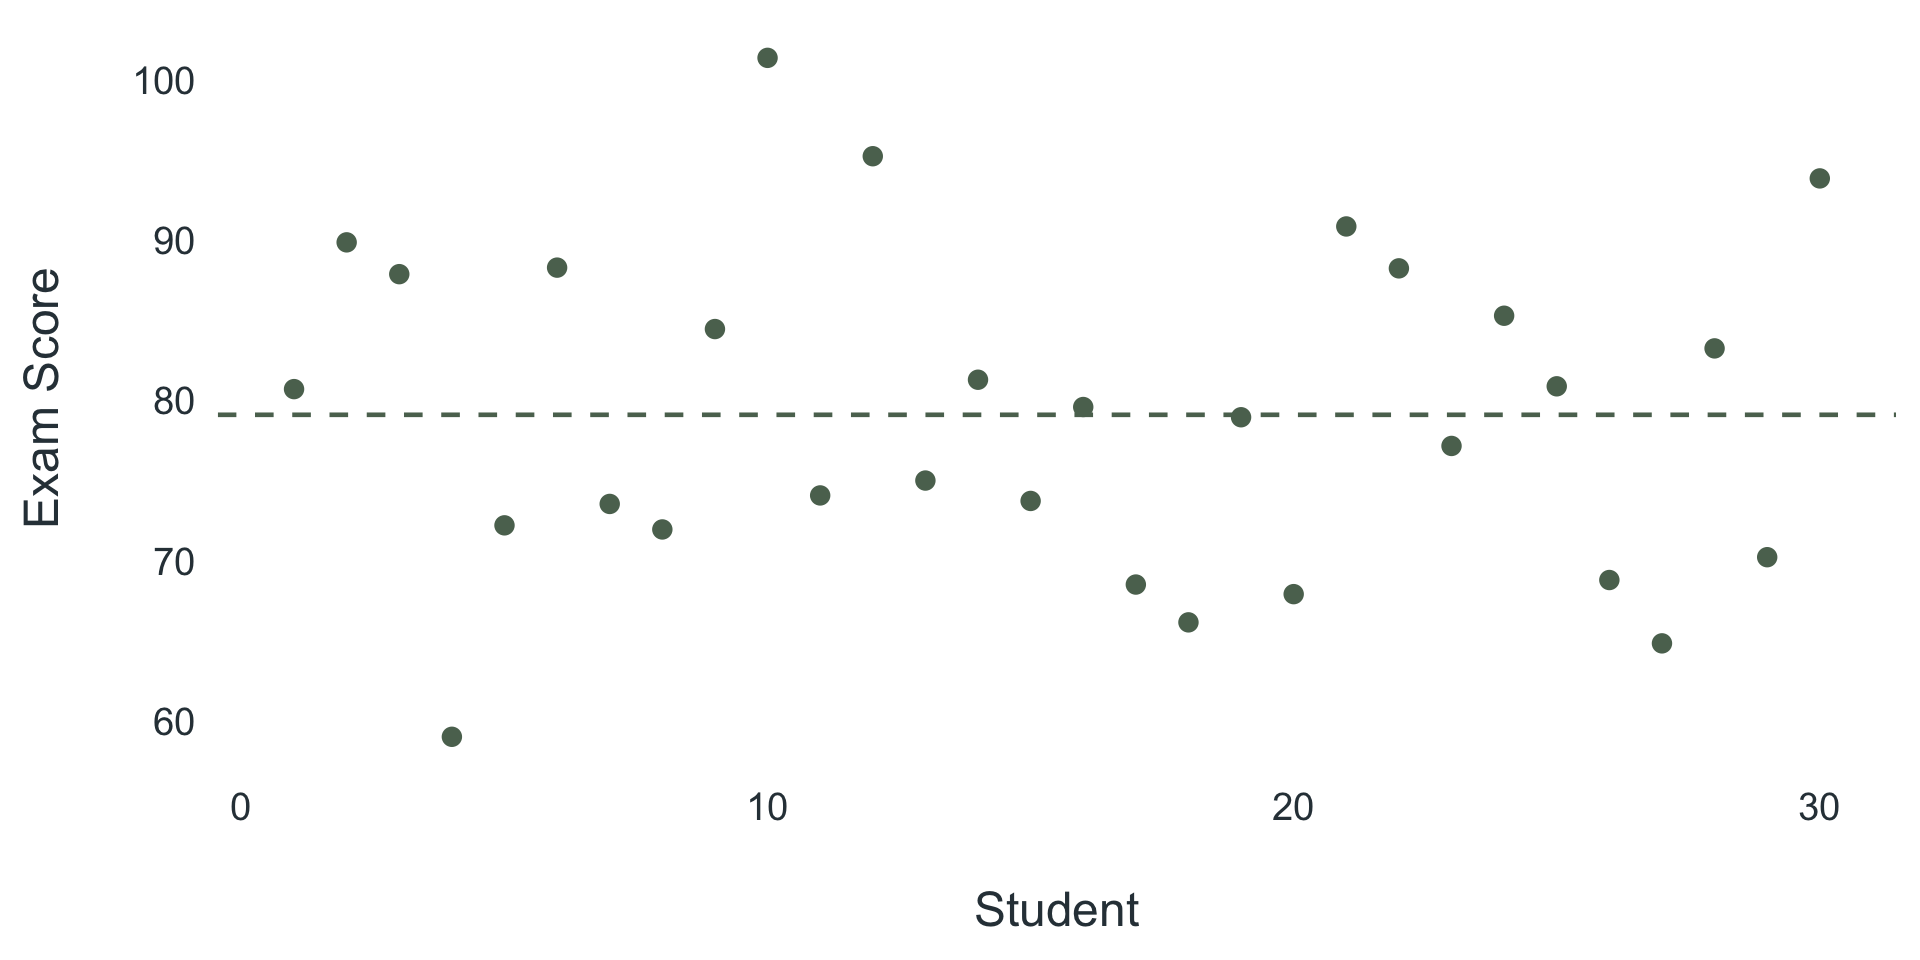
Dispersion
PSY 348: Lecture 4
Dave Brocker
Farmingdale State College
Descriptive Statistics
The Old and the New
\(x\)
\(\color{#B5483B}{\bar{x}}\)
\(\color{#3E6E8E}{\sum(x)}\)
\(\color{#A0527A}{x^2}\) NEW
Descriptive Statistics
The Old and the New
\(x\) = refers to the value for 1 person (1 datapoint) in the sample
\(\color{#B5483B}{\bar{x}}\) = refers to the mean or average value of X in the sample
\(\color{#3E6E8E}{\sum(x)}\) = refers to the sum of all x values (sum of all the datapoints)
\(\color{#A0527A}{x^2}\) = refers to the squared value of x (x multiplied by x) NEW
Descriptive Statistics
Examples
\(data = \{1,4,3,2,4,6\}\)
\(x\) = \(1 \mid 4 \mid 3 \mid 2 \mid 4 \mid 6\)
\(\color{#B5483B}{\bar{x}}\) = \(3.33\bar{3}\)
\(\color{#3E6E8E}{\sum(x)}\) = \(1 + 4 + 3 + 2 + 4 + 6 = 20\)
\(\color{#A0527A}{x^2}\) = \(1 \mid 16 \mid 9 \mid 4 \mid 16 \mid 36\) NEW
Descriptive Statistics
Describe the characteristics of a sample in terms of:
- Central Tendency
- The mid-point of the data – the most typical or frequent answer.
- Dispersion
- Also called variability or variance – how spread out the data is; the action or process of distributing things or people over a wide area.
Central Tendency: Mean
What is it, when should we use it, and how do we calculate it?
- Mean
- The average of all \(x\) values – best used with a normal distribution. Formula: \(\dfrac{\color{#3E6E8E}{\sum(x)}}{\color{#8A5A3C}{n}}\)
Central Tendency: Median
What is it, when should we use it, and how do we calculate it?
- Median
- The middle value in sorted data – best used with a skewed distribution (is the data pulled to the left or the right?). Formula: \(Med(X) = \dfrac{\color{#8A5A3C}{n} + 1}{2}\)
Central Tendency: Mode
What is it, when should we use it, and how do we calculate it?
- Mode
- The most common value (or values, in bi/tri-modal distributions) – shows us where the data is clustered.
Central Tendency
What do measures of Central Tendency tell you?
- The mid-point in the data, and the answer most participants gave.
Central Tendency
What do measures of Central Tendency tell you?
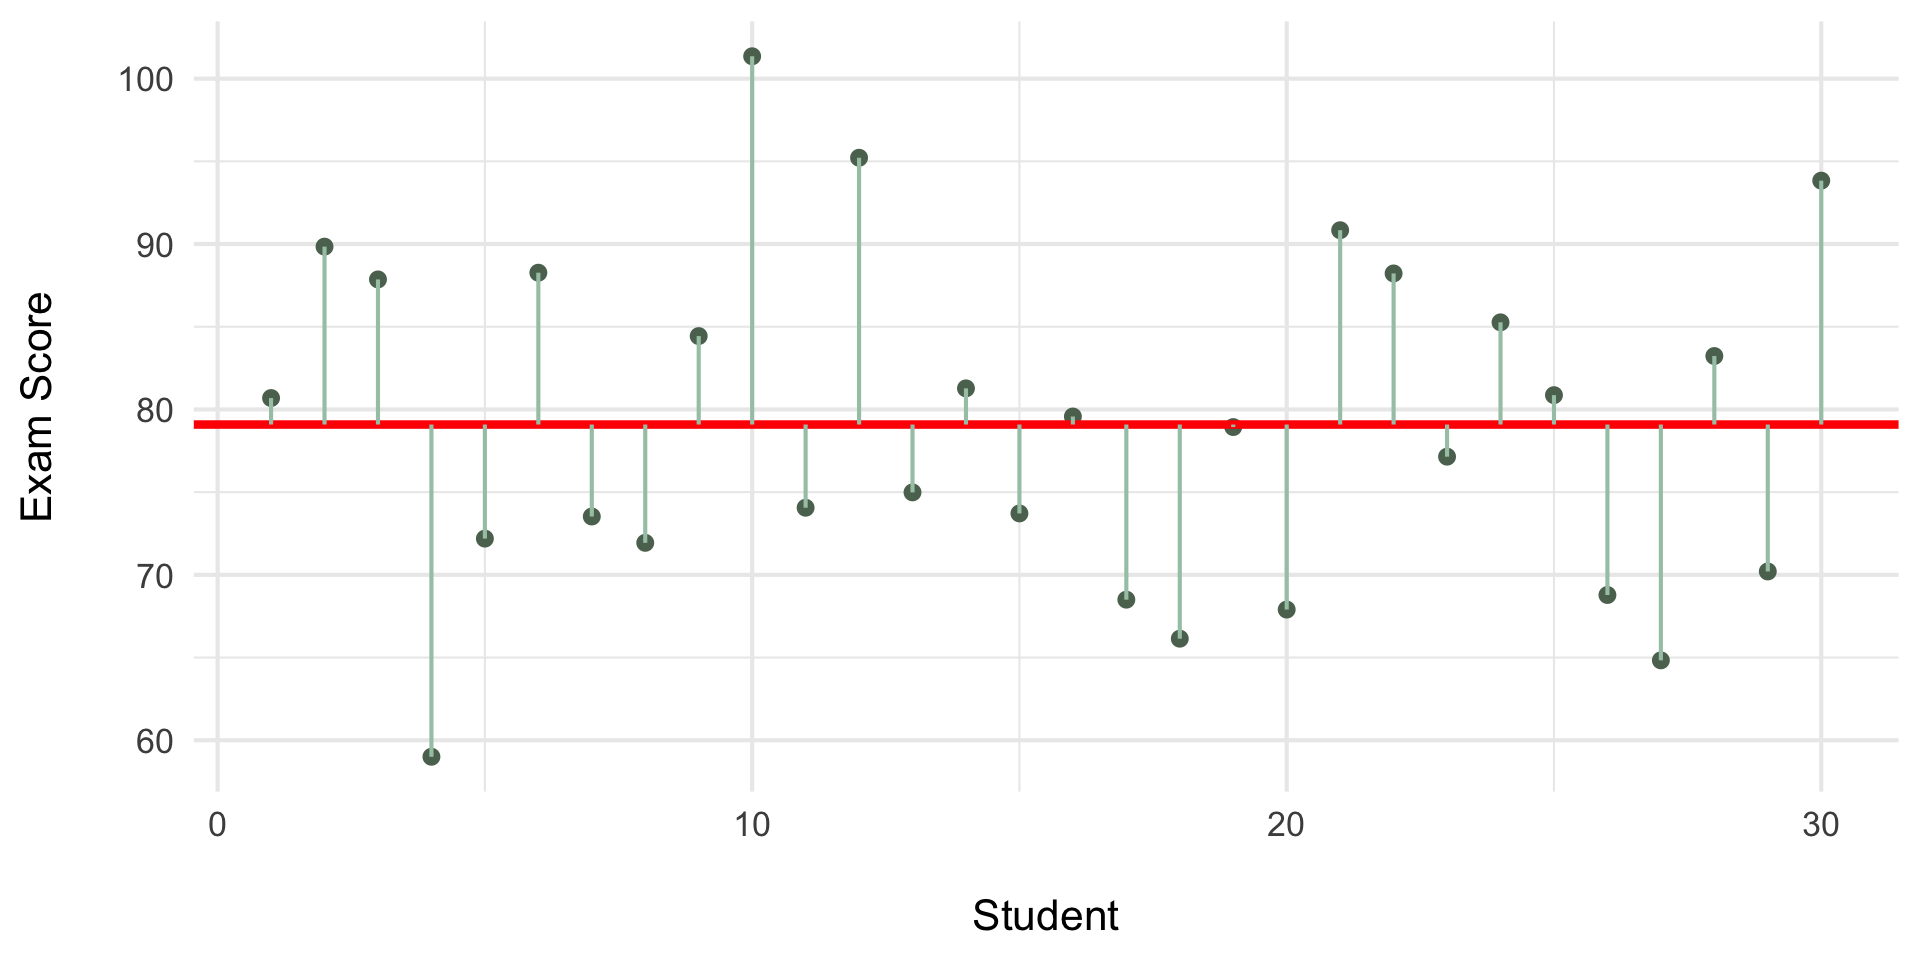
Measures of Dispersion
What does dispersion mean?
Spread
How much the participants’ responses differ from one another
Variance
Measures of Dispersion
Tells us about the spread of the data, but what does that actually mean?
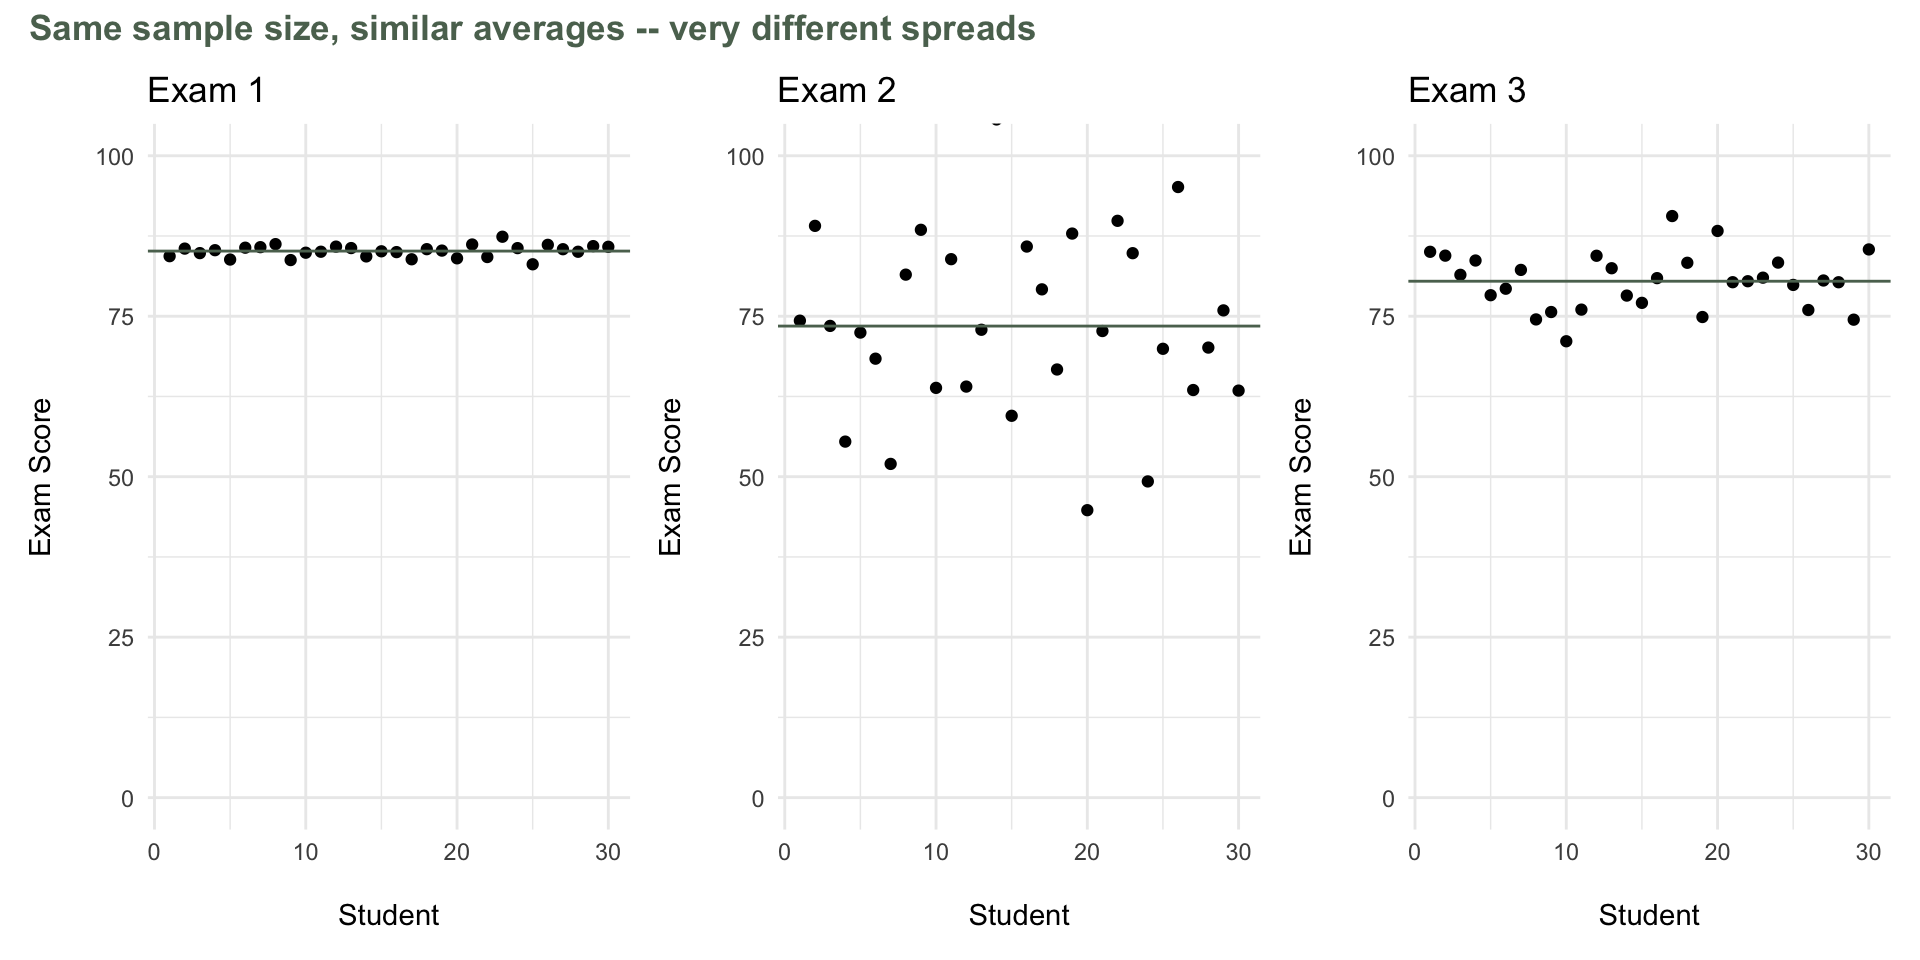
Measures of Dispersion
Measures of dispersion tell us about the spread of the data, but what does that actually mean?
- If I am measuring phone usage what would low dispersion tell me?
- If I am measuring phone usage, what would high dispersion tell me?
Measures of Dispersion
Measures of dispersion tell us about consensus.
Did participants give similar answers?
- \(\begin{bmatrix}1 & 2 & 2 & 1 & 2 & 2 & 3 & 2 & 1\end{bmatrix}\)
Did participants give wildly different answers?
- \(\begin{bmatrix}1 & 3 & 4 & 5 & 8 & 9 & 21 & 33\end{bmatrix}\)
Dispersion
What does that tell us about consensus?
Data should have natural dispersion.
If everyone gives a similar answer, it’s harder to analyze difference.
Calculating Dispersion
How do you think we should calculate dispersion?
On average, how far is each x-value from the midpoint
Calculate how far each x-value is from the midpoint (mean)
Take the average of those distances.
Calculating Dispersion
How do you think we should calculate dispersion?
In psychology, the mid-point we use will be the mean
Calculating Dispersion
Acquire Data
| Sample Data | |
| X values for 10 participants | |
| Participant | X |
|---|---|
| 1 | 1 |
| 2 | 3 |
| 3 | 2 |
| 4 | 2 |
| 5 | 3 |
| 6 | 2 |
| 7 | 1 |
| 8 | 3 |
| 9 | 1 |
| 10 | 2 |
Deviation Scores
Calculate how far each x-value is from the mean
- \(Step\ 1\): Examine Data
- \(data = \{1,3,2,2,3,2,1,3,1,2\}\)
- \(Step\ 2\): Calculate the Mean
- \(\color{#B5483B}{\bar{x}} = \dfrac{\color{#3E6E8E}{\sum(x)}}{\color{#8A5A3C}{n}} = \dfrac{1+3+2+2+3+2+1+3+1+2}{10} = \dfrac{20}{10} = 2\)
Deviation Scores
Calculate how far each x-value is from the mean
Step 2: Subtract the mean from each X-value.
\(x - \color{#B5483B}{\bar{x}}\)
\((1-2) + (3-2) + (2-2) + (2-2)...\)
\((-1) + 1 + 0 + 0...\)
Calculating Dispersion
Visual
| Deviation Scores | ||
| Each x value's distance from the mean | ||
| ParticipantID | x | \(x-\color{#B5483B}{\bar{x}}\) |
|---|---|---|
| 1 | 1 | -1 |
| 2 | 3 | 1 |
| 3 | 2 | 0 |
| 4 | 2 | 0 |
| 5 | 3 | 1 |
| 6 | 2 | 0 |
| 7 | 1 | -1 |
| 8 | 3 | 1 |
| 9 | 1 | -1 |
| 10 | 2 | 0 |
Calculating Dispersion
Visual
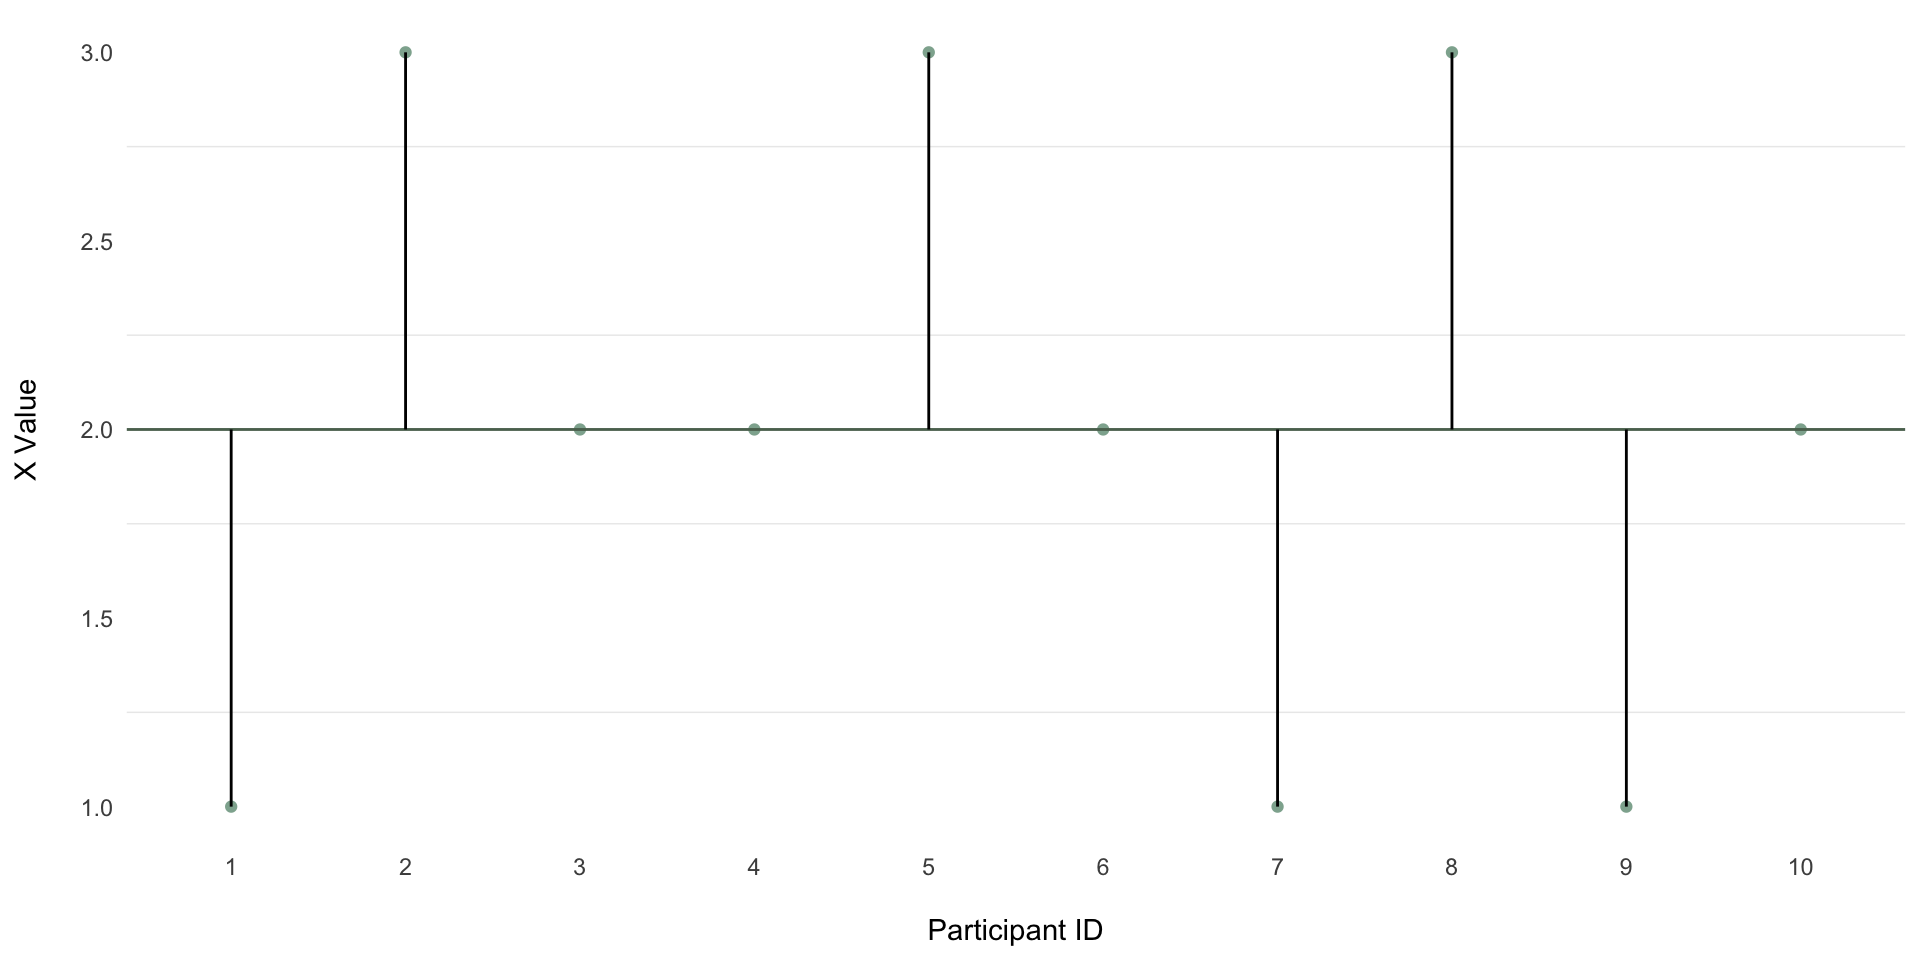
Calculating Dispersion
Visual
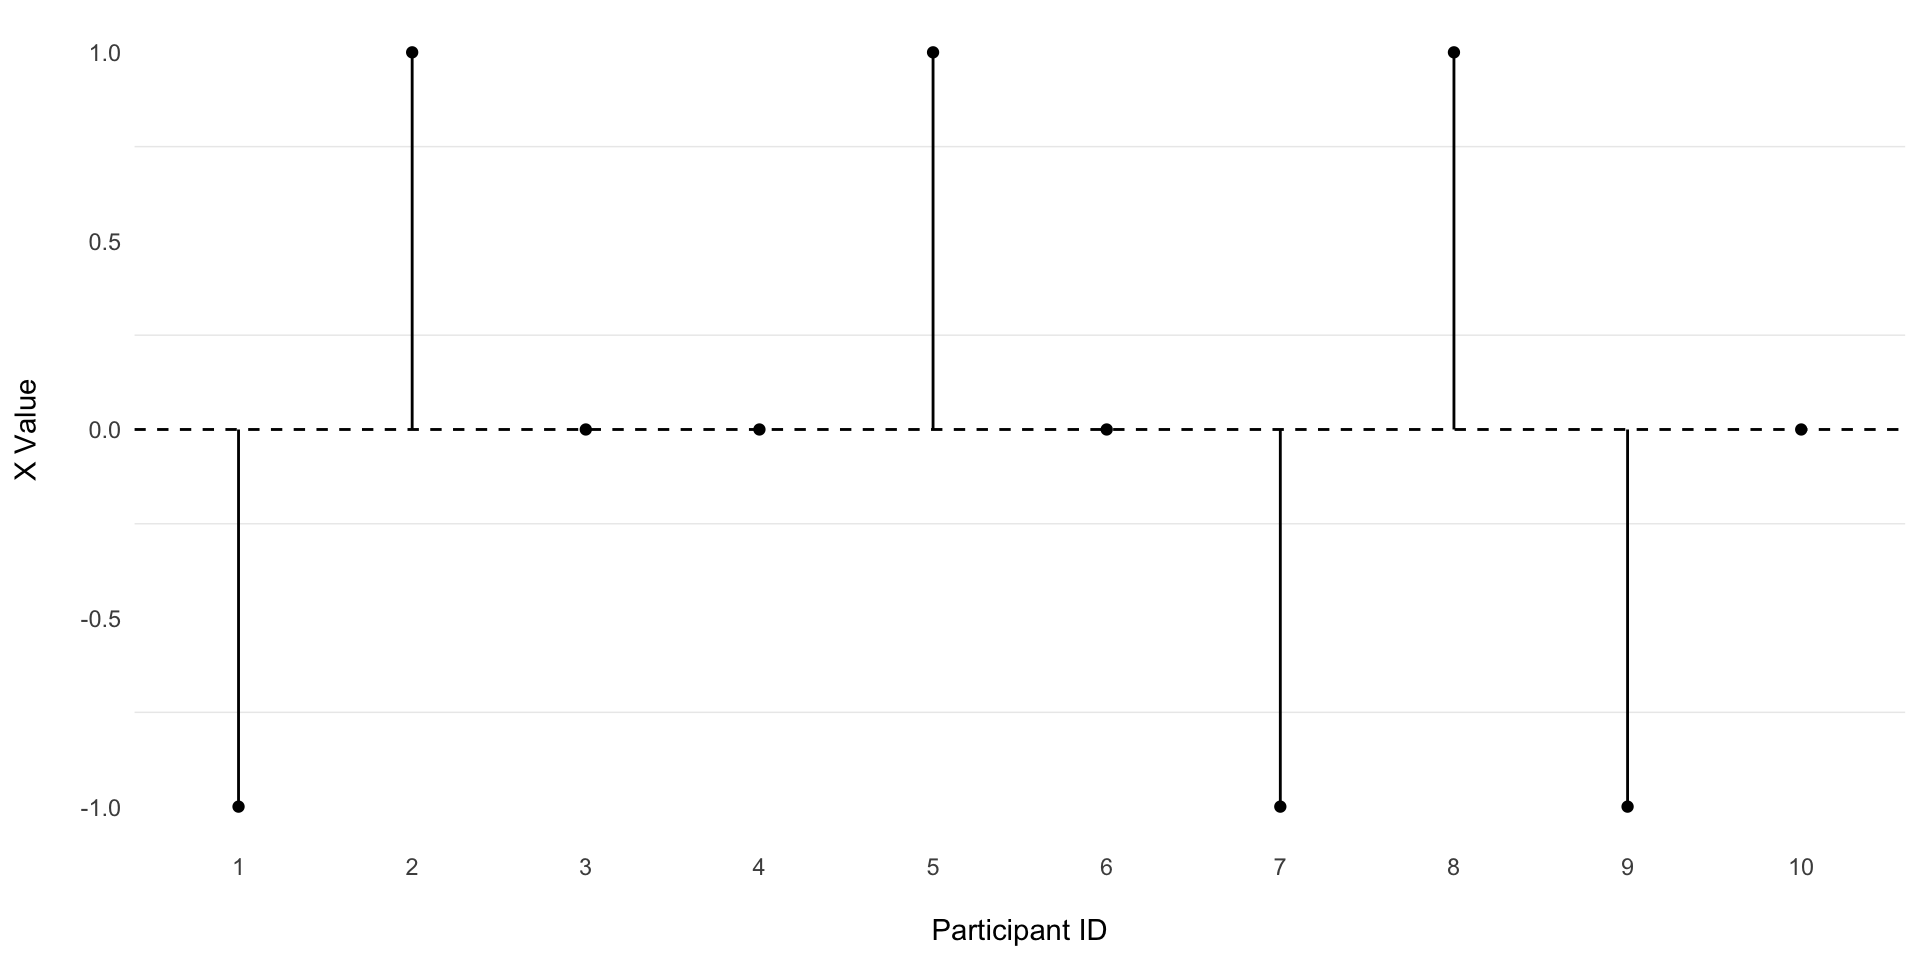
Calculating Dispersion
Visual
The average of the deviation scores will always = 0.
On average, the x-values = x.
So the average distance of x from x is 0.
Calculating Dispersion
How do you think we should calculate dispersion?
- Calculate the mean.
- Calculate the deviation scores.
- What can we do to the deviation scores to prevent them from adding up to 0?
What is the Mean of the Deviation Scores?
Stop Being So Negative!
The problem is the negative numbers!
How do we get rid of negative numbers?
\((x - \color{#B5483B}{\bar{x}}) = (1-2) = -1 \quad\rightarrow\quad (x-\color{#B5483B}{\bar{x}})^2 = (-1)^2 = 1\)
Calculating Dispersion
Stop Being So Negative!
| Squared Deviations | |||
| Removing the negative signs | |||
| ParticipantID | x | \((x-\color{#B5483B}{\bar{x}})\) | \((x-\color{#B5483B}{\bar{x}})^2\) |
|---|---|---|---|
| 1 | 1 | -1 | 1 |
| 2 | 3 | 1 | 1 |
| 3 | 2 | 0 | 0 |
| 4 | 2 | 0 | 0 |
| 5 | 3 | 1 | 1 |
| 6 | 2 | 0 | 0 |
| 7 | 1 | -1 | 1 |
| 8 | 3 | 1 | 1 |
| 9 | 1 | -1 | 1 |
| 10 | 2 | 0 | 0 |
Calculating Dispersion
First 3 Steps
Step 1: Calculate the mean.
Step 2: Subtract the mean from each X-value.
Step 3: Square each deviation score.
Calculating Dispersion
Continuing: Calculate the average squared deviation.
Step 4: Add up the Squared Deviations.
\(1+1+0+1...\)
Calculating Dispersion
Continuing: Calculate the average squared deviation.
| Sum of Squared Deviations | |||
| ParticipantID | x | \((x-\color{#B5483B}{\bar{x}})\) | \((x-\color{#B5483B}{\bar{x}})^2\) |
|---|---|---|---|
| 1 | 1 | -1 | 1 |
| 2 | 3 | 1 | 1 |
| 3 | 2 | 0 | 0 |
| 4 | 2 | 0 | 0 |
| 5 | 3 | 1 | 1 |
| 6 | 2 | 0 | 0 |
| 7 | 1 | -1 | 1 |
| 8 | 3 | 1 | 1 |
| 9 | 1 | -1 | 1 |
| 10 | 2 | 0 | 0 |
Calculating Dispersion
Divide by n-1 to Estimate
Step 5: Divide by (n-1).
\(\dfrac{\color{#3E6E8E}{\sum} (x-\color{#B5483B}{\bar{x}})^2}{\color{#8A5A3C}{n}-1}\)
(n-1) is called the degrees of freedom – we use it here because we’re estimating the population’s variance from a sample, and dividing by a slightly smaller number corrects for that estimation.
- Variance
- The fact or quality of being different, divergent, or inconsistent.
Calculating Dispersion
How do think we should calculate dispersion?
When we squared the deviation scores in Step 3, we inflated the deviation.
We have to undo that inflation.
How do you undo squaring?
We take the square root.
Calculating Dispersion
Inflation
| Why We Divide by n − 1 | ||||
| Correcting the inflation from squaring | ||||
| ParticipantID | X | \((x-\color{#B5483B}{\bar{x}})\) | \((x-\color{#B5483B}{\bar{x}})^2\) | |
|---|---|---|---|---|
| 1 | 40.55 | −2.79 | 7.782 | |
| 2 | 48.55 | 5.21 | 27.145 | |
| 3 | 46.751 | 3.411 | 11.636 | |
| 4 | 42.035 | −1.304 | 1.701 | |
| 5 | 45.682 | 2.342 | 5.485 | |
| 6 | 36.47 | −6.869 | 47.188 | |
| Sum | — | — | — | 100.93818 |
| Mean | — | — | — | 20.18764 |
Calculating Dispersion
Step 6: Take the square root.
\[ \Large{\sqrt{\dfrac{\color{#3E6E8E}{\sum}(x-\color{#B5483B}{\bar{x}})^2}{\color{#8A5A3C}{n}-1}}} \]
Calculating Standard Deviation
Step-by-Step
Tip
- Mean: Calculate the mean – \(\color{#B5483B}{\bar{x}}\)
- Deviation scores: Subtract the mean from each x-value – \((x-\color{#B5483B}{\bar{x}})\)
- Squared deviations: Square each deviation score – \((x-\color{#B5483B}{\bar{x}})^2\)
- Sum of squares: Add up the squared deviations – \(\color{#3E6E8E}{\sum}(x-\color{#B5483B}{\bar{x}})^2\)
Calculating Standard Deviation
Step-by-Step
Tip
- Variance: Divide the sum of squares by (n-1) – \(\dfrac{\color{#3E6E8E}{\sum}(x-\color{#B5483B}{\bar{x}})^2}{\color{#8A5A3C}{n}-1}\)
- Standard Deviation: Take the square root of the variance – \(\sqrt{\dfrac{\color{#3E6E8E}{\sum}(x-\color{#B5483B}{\bar{x}})^2}{\color{#8A5A3C}{n}-1}}\)
Formulas for Dispersion
Variance and Standard Deviation
Variance
\[ \large{\color{#7A5C99}{s^2} = \frac{\color{#3E6E8E}{\sum}(x-\color{#B5483B}{\bar{x}})^2}{\color{#8A5A3C}{n}-1}} \]
Standard Deviation
\[ \large{\color{#5C715E}{s} = \sqrt{\frac{\color{#3E6E8E}{\sum}(x-\color{#B5483B}{\bar{x}})^2}{\color{#8A5A3C}{n}-1}}} \]
Formulas for Dispersion
Standard Deviation
Variance is a measure of dispersion.
- It’s not helpful, because it’s inflated (from squaring the deviation scores).
Standard deviation is a better measure of dispersion, because it is standardized.
- This means that a standard deviation of 1 means a distance of 1 on the scale used to measure x.
Variance & Standard deviation
The Relationship
- Variance
- The standard deviation, squared – \(\color{#7A5C99}{s^2}\).
- Standard Deviation
- The square root of the variance – \(\color{#5C715E}{s}\).
Practice 1
Basic mean, deviations, variance, SD
Tip
Problem (do by hand first):
Compute the sample mean, each deviation from the mean, the sum of squared deviations, the sample variance, and the sample standard deviation for the dataset:
\(x = [4, 2, 5, 6, 3]\)
Practice 1
Solution (steps)
Tip
- Sum: \(\color{#3E6E8E}{\sum} x = 4+2+5+6+3 = 20\)
- Sample size: \(\color{#8A5A3C}{n} = 5\)
- Mean: \(\color{#B5483B}{\bar{x}} = \dfrac{20}{5} = 4\)
- Deviations: \(x_i - \color{#B5483B}{\bar{x}} = [0, -2, 1, 2, -1]\)
- Squared deviations: \([0, 4, 1, 4, 1]\)
- Sum of squared deviations: \(0+4+1+4+1 = 10\)
- Sample variance: \(\color{#7A5C99}{s^2} = \dfrac{\color{#3E6E8E}{\sum} (x_i-\color{#B5483B}{\bar{x}})^2}{\color{#8A5A3C}{n}-1} = \dfrac{10}{4} = 2.5\)
- Sample SD: \(\color{#5C715E}{s} = \sqrt{2.5} \approx 1.5811\)
practice1.R
x <- c(4,2,5,6,3)
n <- length(x)
sum_x <- sum(x)
mean_x <- mean(x)
deviations <- x - mean_x
sq_dev <- deviations^2
ssd <- sum(sq_dev)
s2 <- var(x)  # sample variance by default (n-1)
s <- sd(x)
list(
  n = n,
  sum = sum_x,
  mean = mean_x,
  deviations = deviations,
  squared_deviations = sq_dev,
  sum_squared_deviations = ssd,
  sample_variance = s2,
  sample_sd = s
)
$n
[1] 5
$sum
[1] 20
$mean
[1] 4
$deviations
[1] 0 -2 1 2 -1
$squared_deviations
[1] 0 4 1 4 1
$sum_squared_deviations
[1] 10
$sample_variance
[1] 2.5
$sample_sd
[1] 1.581139Problem 2: Comparing dispersion
Mathematically
Tip
Two instructors have class scores:
- Class A: \(scores_A = [80, 82, 78, 85, 75]\)
- Class B: \(scores_B = [60, 90, 75, 85, 85]\)
- Compute the mean and sample SD for each class.
- Both classes have similar means. Which class has greater dispersion? What does that imply about reporting a “typical” student score?
Problem 2: Comparing dispersion
Mathematically
Tip
Class A
- Mean: \(\color{#B5483B}{\bar{x}_A} = \dfrac{80+82+78+85+75}{5} = \dfrac{400}{5} = 80\)
- Deviations: \(x_i - \color{#B5483B}{\bar{x}_A} = [0, 2, -2, 5, -5]\)
- Squared deviations: \((x_i - \color{#B5483B}{\bar{x}_A})^2 = [0, 4, 4, 25, 25]\)
- Variance and SD: \(\color{#7A5C99}{s_A^2} = \dfrac{\color{#3E6E8E}{\sum} (x_i - \color{#B5483B}{\bar{x}_A})^2}{\color{#8A5A3C}{n}-1} = \dfrac{58}{4} = 14.5 \quad\rightarrow\quad \color{#5C715E}{s_A} = \sqrt{14.5} \approx 3.81\)
Tip
Class B
- Mean: \(\color{#B5483B}{\bar{x}_B} = \dfrac{60+90+75+85+85}{5} = \dfrac{395}{5} = 79\)
- Deviations: \(x_i - \color{#B5483B}{\bar{x}_B} = [-19, 11, -4, 6, 6]\)
- Squared deviations: \((x_i - \color{#B5483B}{\bar{x}_B})^2 = [361, 121, 16, 36, 36]\)
- Variance and SD: \(\color{#7A5C99}{s_B^2} = \dfrac{\color{#3E6E8E}{\sum} (x_i - \color{#B5483B}{\bar{x}_B})^2}{\color{#8A5A3C}{n}-1} = \dfrac{570}{4} = 142.5 \quad\rightarrow\quad \color{#5C715E}{s_B} = \sqrt{142.5} \approx 11.94\)
Interpretation
- Class A: \(\color{#B5483B}{\bar{x}} = 80, \color{#5C715E}{s} \approx 3.81\)
- Class B: \(\color{#B5483B}{\bar{x}} = 79, \color{#5C715E}{s} \approx 11.94\)
Problem 2: Comparing dispersion
Computationally
Dispersion | ⬡⬢⬡⬢