
Scales of Measurement and Measures of Central Tendency
PSY 348: Lecture 3
Dave Brocker
Farmingdale State College
Studying Psychology
What do researchers in the areas of psychology that are interesting to you study?
Attitudes
Beliefs
Behaviors
Physiology
Planning
Brain Activity
Thoughts
Performance/Ability
Attenton
Memory
Studying Psychology
The Bobo Doll Experiment (Bandura, 1961)
Studying Psychology
Defining Variables
Operationalization
- The process of defining the measurement of a phenomenon that is not directly measurable (AKA a latent variable) though its existence is implied by other phenomena.
How could we measure happiness?
mood
Operationalization
Figuring out how to measure something you can’t directly measure.
Attitudes
Beliefs
Thoughts
Behaviors
Brain activity
Performance/Abilities
What if I wanted to measure disgust?
Operationalization
Types of Measurements
Self-Report or Behavioral Measures
Observation
Implicit Measures
Tests
Types of Measurements
Self-report
Surveys
Questionnaires
Polls
Quizzes
Instruments
Self-Report
What’s wrong with this?
Self-Report:
Advantages
Most popular method of assessing attitudes
Can obtain large amounts of data
- (Fairly) Quick
Allows for adaptive testing
- (Fairly) Inexpensive
Self-Report:
Disadvantages
Acquiescence
- Tendency to say yes, true, agree
Social desirability
- Tendency to respond in ways that are seen as socially acceptable
Demand characteristics
- Tendency to response in ways that participant thinks researcher wants
Self-Report:
Avoiding Disadvantages
Anonymous respondents are less likely to make things up
- Assure anonymity
Allow respondents to answer in private
- Allow for maximum privacy
Don’t make your experiment too obvious/revealing
- Obscure the true goal of the experiment
Add questions that test for respondent awareness
- Include attention checks
Purposely make some questions opposite
- Reverse coding
Behavioral Measures
Examples
Taking a flier
Signing a petition
Internet Behavior
Moving a chair
Donating money
Observation
The Bobo Doll Experiment (Bandura, 1961)
The Bobo Doll Experiment
(Bandura, 1961)
Live aggression by adult
Videotaped aggression by adult
Cartoon aggression
- No aggression
Observation
Disadvantages
Time consuming
Different reviewers/observers may score behaviors differently.
Coding scheme
- Who decides what is an example of the behavior?
Inter-rater Reliability
- How much agreement is there between 2+ observers?
Implicit measures
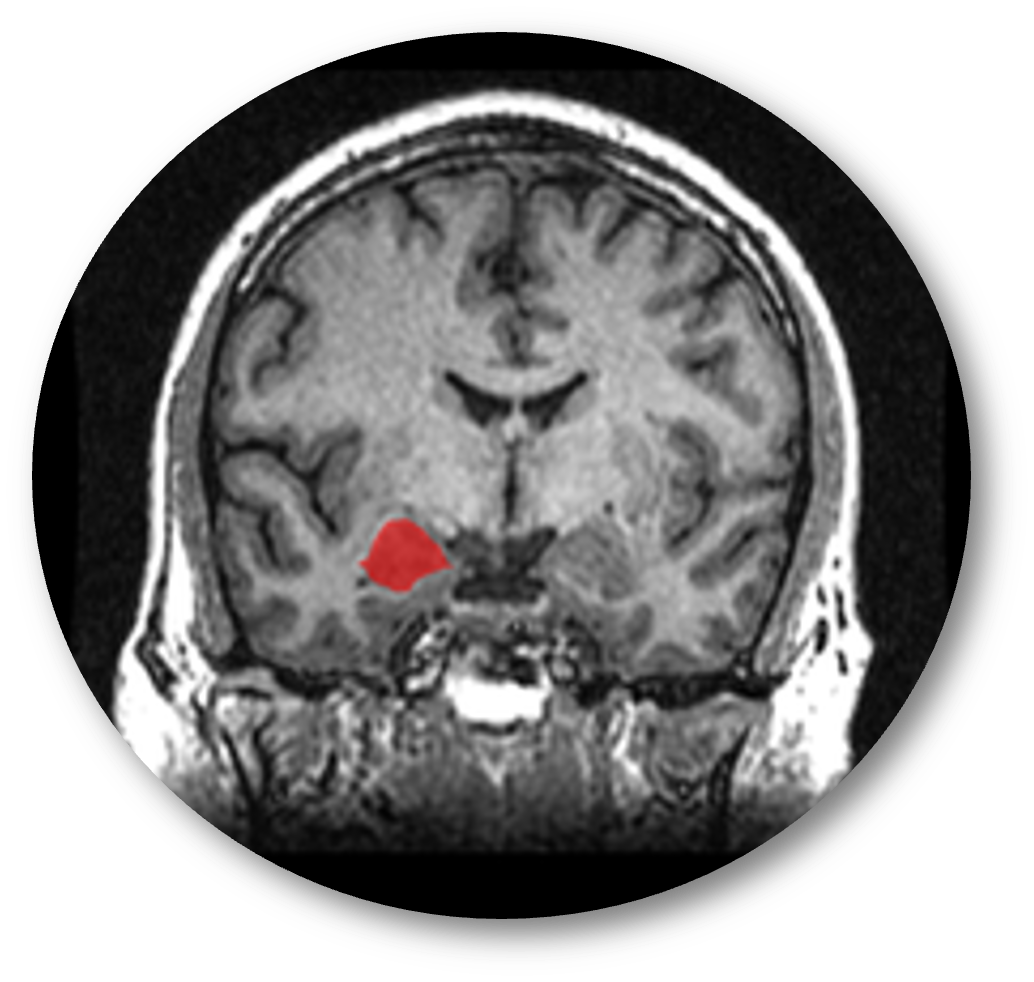
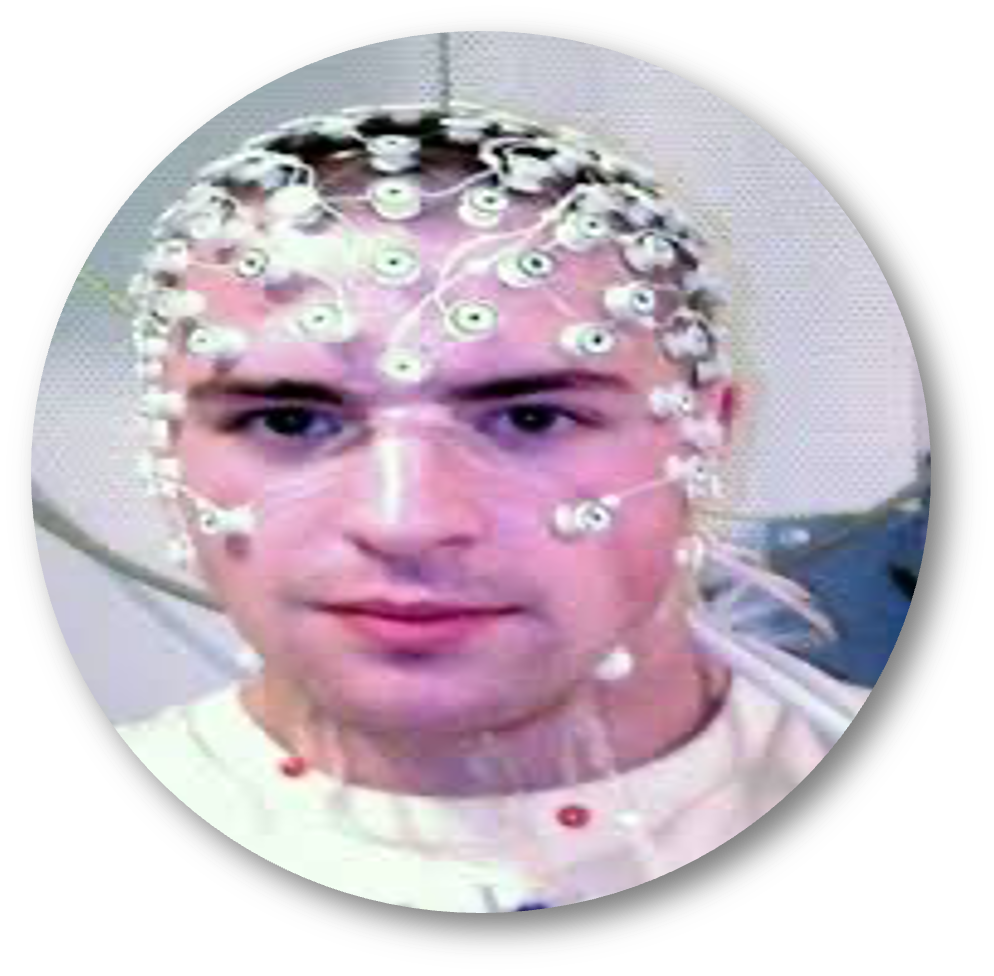
Brain activity
Functional Magnetic Resonance Imaging (fMRI)
Neuroimaging of brain activity
![]()
Electroencephalography (EEG)
Electrodes on surface of scalp measures brain activity
![]()
Issues with Operationalization
Why is it hard to measure psychological phenomena?
Others may choose to measure the phenomena differently from us
Operationalization can be culture-specific
What we measure is based on observable parts of the phenomena, but some parts may not be able to be observed
- Measuring only the observable is imprecise
How else could Bandura have measured aggression?
Operationalization
How should we measure aggression in children?
Observe children for one hour and…
Label them as Aggressive or Non-Aggressive
Rank them from most aggressive to least aggressive
Score them on a 10-point scale.
1 = No Aggression
10 = All of the Aggression
Count number of aggressive behaviors
Scales of measurement
A Scale By Any Other Name
LabelsNominalRankOrderScaleIntervalCountRatio
Nominal (Categories, No Order)
- Type of therapy (CBT, psychoanalysis, EMDR)
- Diagnosis (Major Depressive Disorder, Generalized Anxiety Disorder, none)
- Relationship status (single, dating, married, divorced)
- Coffee drinker vs. non-coffee drinker
Raise your hand if you’re a coffee drinker, tea drinker, or energy-drink person. That’s nominal data.
Ordinal (Ranked, Uneven Gaps)
Examples:
- Rank order of stress: mild / moderate / severe
- Olympic medals (gold, silver, bronze)
- Likert-style agreement (Strongly Disagree → Strongly Agree) — though technically often treated as interval in practice
- Clinical severity ratings (minimal, mild, moderate, severe depression)
Who’s seen the movie Inside Out? Imagine ranking the emotions in order of how often you feel them—Fear first, then Joy, then Anger. That’s ordinal.
Interval (equal distances, no true zero)
Examples:
IQ scores
Standardized test scores (e.g., SAT, GRE)
Temperature in Fahrenheit or Celsius
GPA
If someone has a GPA of 0.0, does that mean they don’t exist as a student? No—it just means they failed. That’s why GPA is interval, not ratio.
Ratio (equal distances, true zero)
Examples:
Reaction time (can be 0 ms)
Number of therapy sessions attended
Cortisol level in blood
Hours of sleep last night
Money donated to a cause
How many hours of sleep did you get last night? If you got 0, that really means 0. Ratio scale.
Interval vs Ratio
What’s the difference between interval and ratio?
Interval may have a 0 on the scale, but it doesn’t mean the absence of something. A 0.0 GPA means an F rather than the absence of a grade.
Ratio has a 0 that. means 0 (the absence of something), like a ‘0’ as a response to the questions, “How many drinks did you have last night?”
Discrete and Continuous
What’s the Difference?
Discrete and Continuous
Discrete variables have predefined values
Number of siblings (you can’t have 2.5 siblings)
Number of errors on a test
Types of therapy (CBT, psychoanalysis, none)
Diagnostic category (depression, anxiety, bipolar, etc.)
Eye color
Number of cups of coffee consumed today
Discrete and Continuous
Continuous Variables can occupy several different values
Reaction time (seconds, milliseconds)
Height (inches, centimeters)
Weight (pounds, kilograms)
Self-esteem score on a 1–10 scale
GPA
Hours of sleep last night (can be 7.25 hours)
Brain activity (EEG voltage, fMRI signal intensity)
Determining Scale of measurement
Identify the scale of measurement.
Undergraduates report their self-esteem on a scale of 1 to 10. Researchers assess the relationship of undergraduates’ self-esteem and GPA.
Predictor variable: Self-Esteem | Continuous (Interval)
Outcome variable: GPA | Continuous (Interval)
Determining Scale of measurement
Identify the scale of measurement.
Participants are given a mystery drug or placebo and then asked to complete puzzle tasks. Researchers time how long participants take to complete the puzzles.
Independent variable: Drug vs. Placebo | Categorical (Nominal)
Dependent variable: Reaction Time | Continuous (Ratio)
Determining Scale of measurement
Identify the scale of measurement.
Undergraduates are shown either pictures of death or pictures of landscapes. They then report their anxiety about aging on a scale of 1 (none) to 10 (lots).
Independent variable: Pictures of death versus landscapes | Categorical (Nominal)
Dependent variable: Anxiety about dying | Continuous (Interval)
Why does scale of measurement matter?
For Science!
Statistical tests can only be run on specific scales of measurement.
t-test & ANOVA: Nominal IV/predictor and Continuous DV/outcome
Correlation & Regression: All continuous
Why does scale of measurement matter?
Generally, continuous variables (interval and ratio scales) lend themselves better to statistical analysis.
As a researcher, you should plan out your statistical analysis BEFORE conducting your study, so that you measure your variables in a way that matches the type of analyses you will run.
Takeaway: How we measure variables matters…
because it dictates what kind of statistical analyses we can run.
Data can be coerced into different formats
‘Correct’ or ‘Supporting’ results can come from bogus data
We’ve measured aggression/self-esteem/attention. Now, how do we summarize all these numbers?
Statistical Terms & Symbols

Statistical Symbols
Case-sensitive and often Greek
\(n\) = the number of people in the sample
\(x\) = one datapoint in a sample
\(\bar{x}\) = Arithmetic mean (average) for a sample, x
\(\Sigma(x)\) = The sum of all values in a sample, x
\(\sum^{n}_{i = 1}= x_1 +x_2+x_3...\)
Practice 1
Study Up!
Esmeralda is taking Statistics for the Psychological Sciences. On her first exam, she scored 98. The average grade among the 26 students on that exam was 97
n:
x:
\(\bar{x}\):
Practice 2
Have you ever heard of this show?
Dave is interested in how many FSC students watch the Netflix Original, Dark. He plans to ask 200 students if they have seen it or not.
N:
n:
Scale of Measurement:
Practice 3
Be Kind to Yourself!
A research study surveys 500 college student across 5 campuses in the United States, asking them to rate their self-esteem on a scale of 1 to 10.
Sample:
Population:
Scale of Measurement:
Measures of Central Tendency
Part 2: What’s in the Middle?
Review
Scales of Measurement
What are the 4 scales of measurement
What are the only scales of measurement that matter for us?
Review
Scales of Measurement
Nominal
- Categories, No Equal Gaps
Ordinal
- Ordered, No Equal Gaps
Interval
- Quantitative, Equal Gaps, No True 0
Ratio
- Quantitative, Equal Gaps, True 0
Review
Statistical Terms
n = ?
x = ?
\(\bar{x}\) = ?
Review
Statistical Terms
n = the number of people in the sample
x = one participant’s score
\(\bar{x}\) = sample mean (pronounced x-bar)
Review
Statistical Terms
What is a parameter?
- Information that describes the population.
What is a statistic?
Information that describes the sample.
Inferences about the population based on information from the sample.
Descriptive Statistics
Describe the characteristics of the sample.
Think about our data on time spent on Instagram/phones in general.
How could we describe it?
Average
- Overall, what is the typical duration
Min & Max
- Highest and Lowest
Most Frequent/Most Infrequent
What are the most common durations?
Least common?
Descriptive Statistics
Describe the characteristics of a sample in terms of:
Central tendency: What most people said (mean, median, and mode)
Dispersion: How spread out the data are (standard deviation)
Measures of Central tendency
Tell us about the mid-point (center) of a distribution.
Tell us about the mid-point (center) of a distribution.
Tell us most participants’ answer.
The average GPA in the class is 3.2
What does that actually mean?
Measures of Central tendency
Mean | Average
Important
The average; obtained by summing all values and dividing by the number of values.
\(\large{\sum^{n}_{i=1} = x_1 + x_2...}\)
\(\large{\frac{\sum(x)}{n}}\)
\(\large{[3,4,5,2,1] = \frac{\sum(3+4+5+2+1)}{5} = \frac{15}{5} = \bar{x} = 3}\)
Think about how you calculate your GPA or grade for a class
When would you use this in research?
Measures of Central tendency
Median
Important
The middle number; obtained by ordering all values from lowest to highest and taking the middle (if n is odd or the average of the 2 middle if n is even)
\(\large{x = \{4,2,5,6,3\}}\)
\(\large{x = \{2,3,4,5,6\}}\)
\(\large{x = \{2,3,\color{blue}{4},5,6\}}\)
Why is median typically used for income?
When would you want this for research?
Measures of Central tendency
Mode
Important
The most frequent answer; obtained by counting how many times each answer is given and taking the value that occurs most often
\(x = [1,1,2,2,\color{green}{3},\color{green}{3},\color{green}{3},4,5,7,8]\)
What’s your favorite genre of music?
When would you want this for research?
Measures of Central tendency
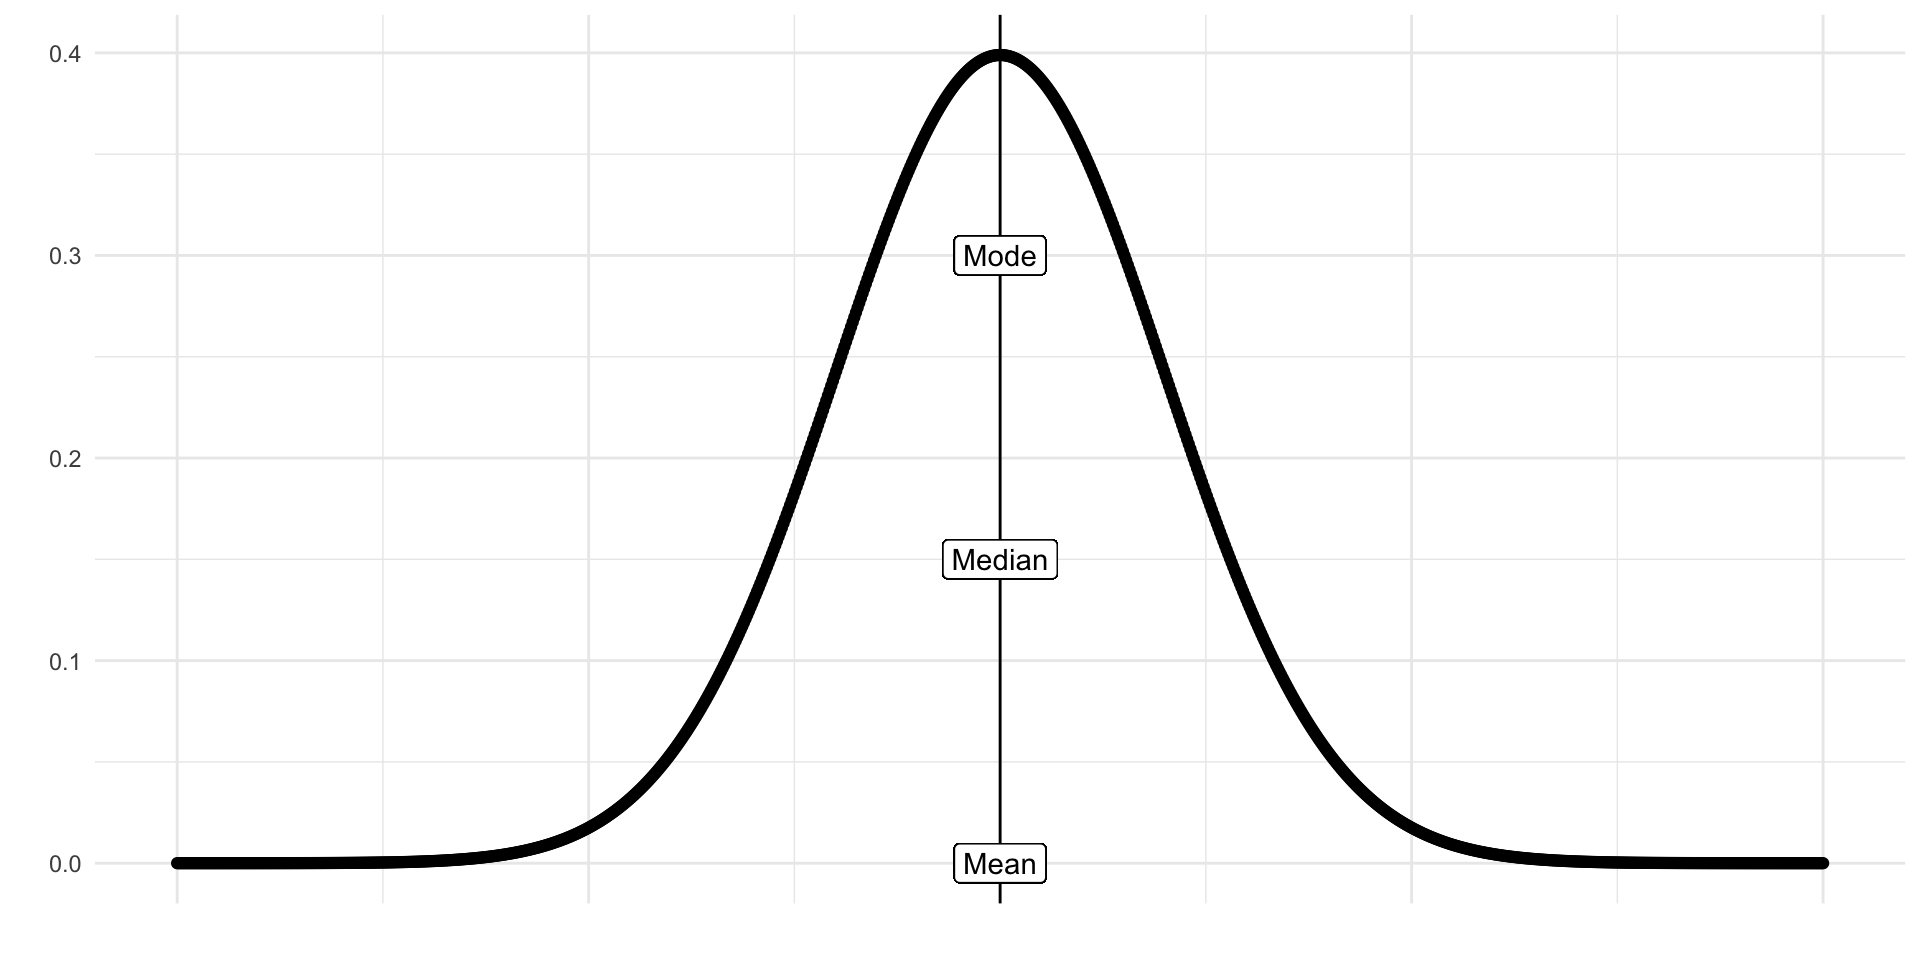
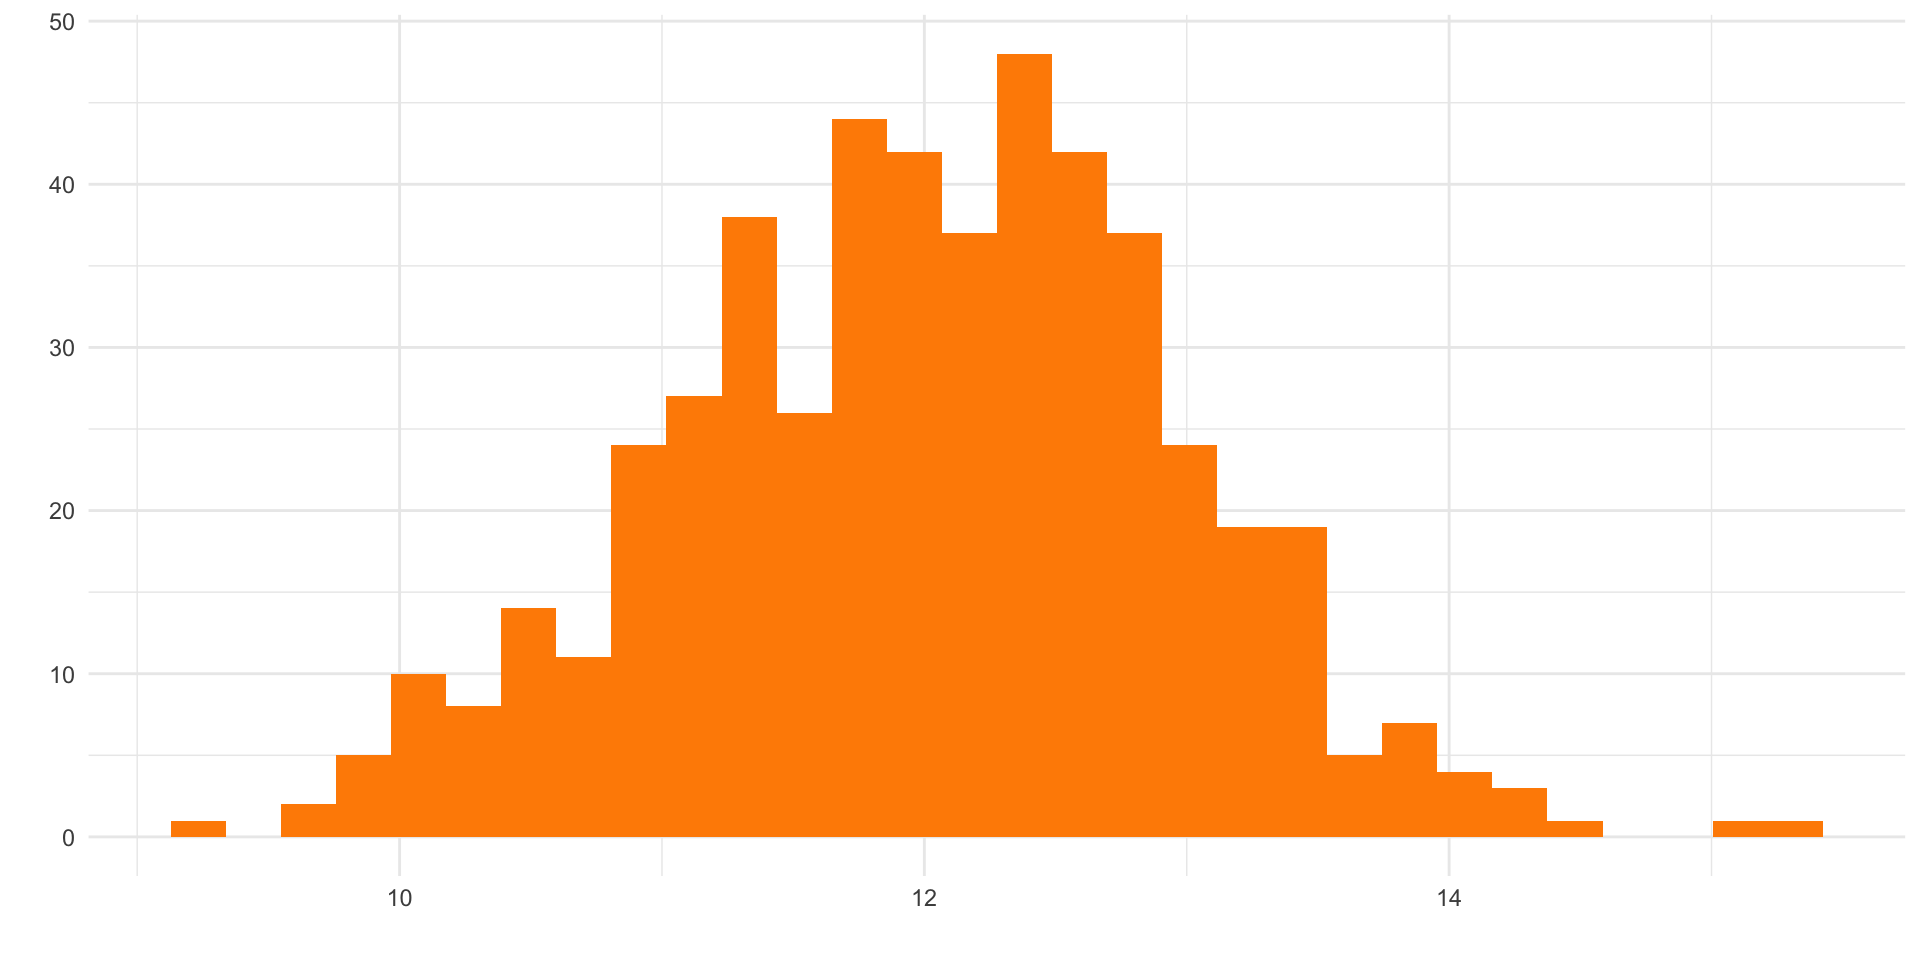
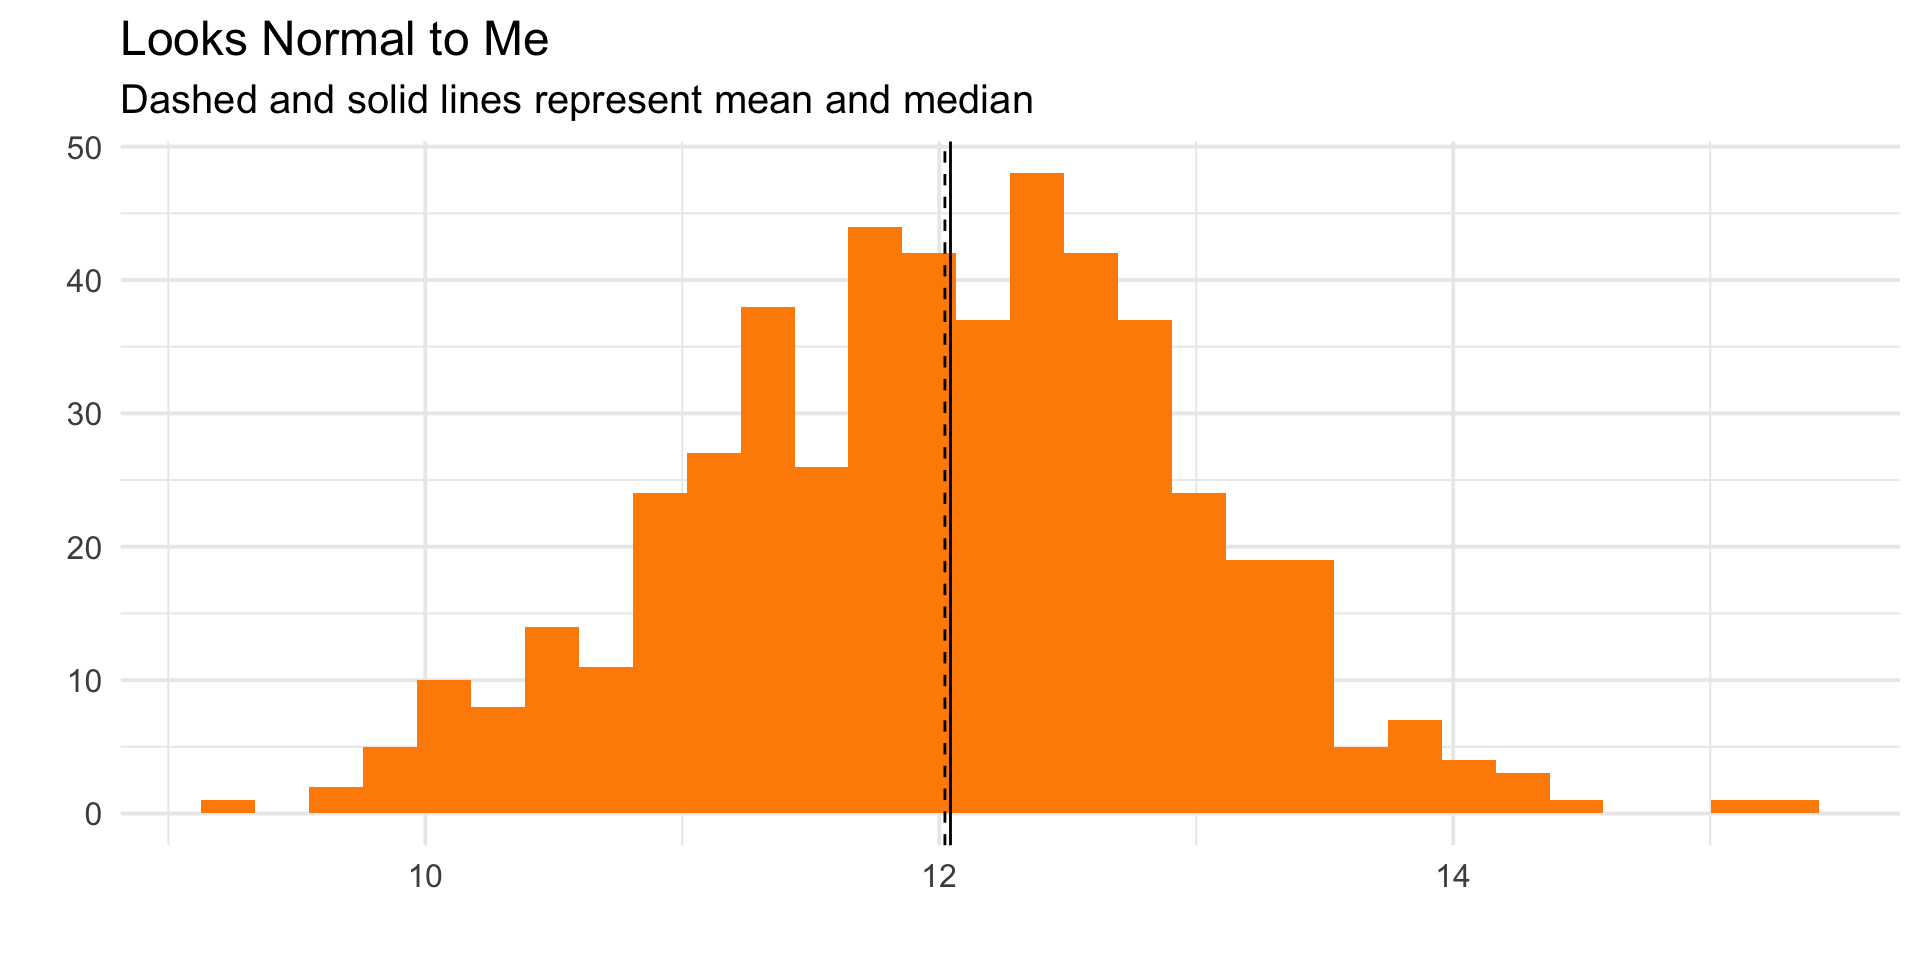
Standard Normal Distribution
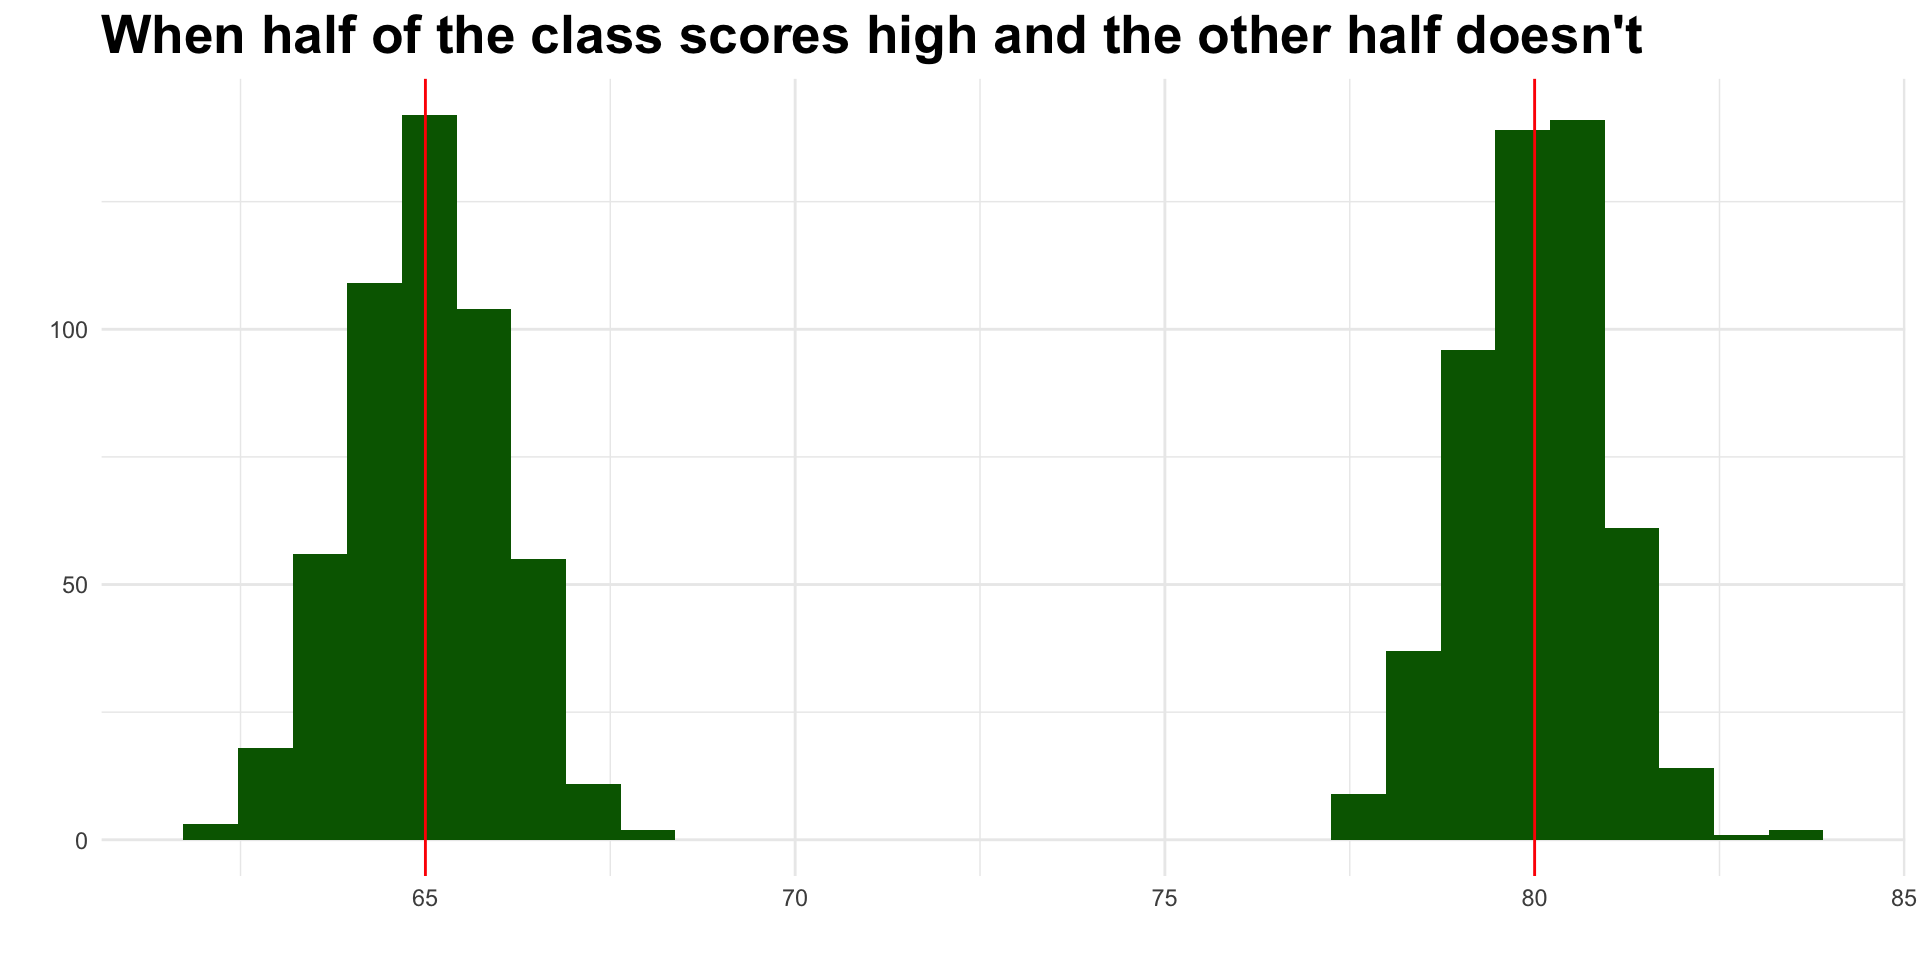
In a normal distribution, the mean, median, and mode are equal to one another.
Mean = Median = Mode
Measures of Central Tendency
Mean
The mean is only helpful in a normal distribution, which you may have heard called a normal curve or bell curve.
We overwhelmingly use the mean, because in the social and behavioral sciences, we nearly always assume the distribution is normal.
Why Do We Assume Normality?
We assume normality because the math works better
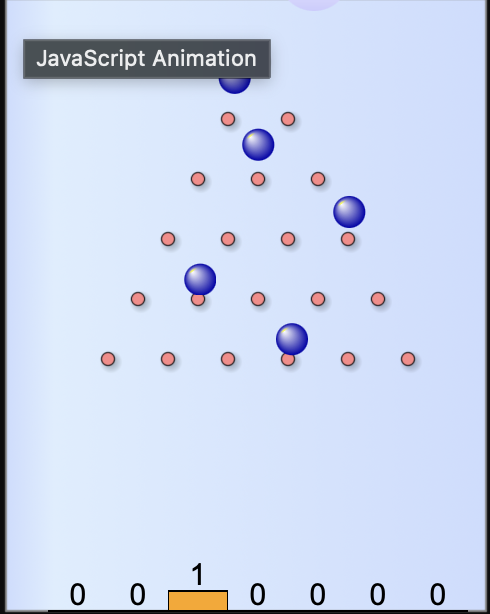
The Central Limit Theorem makes it reasonable
Many human traits actually do cluster in bell-shaped patterns.
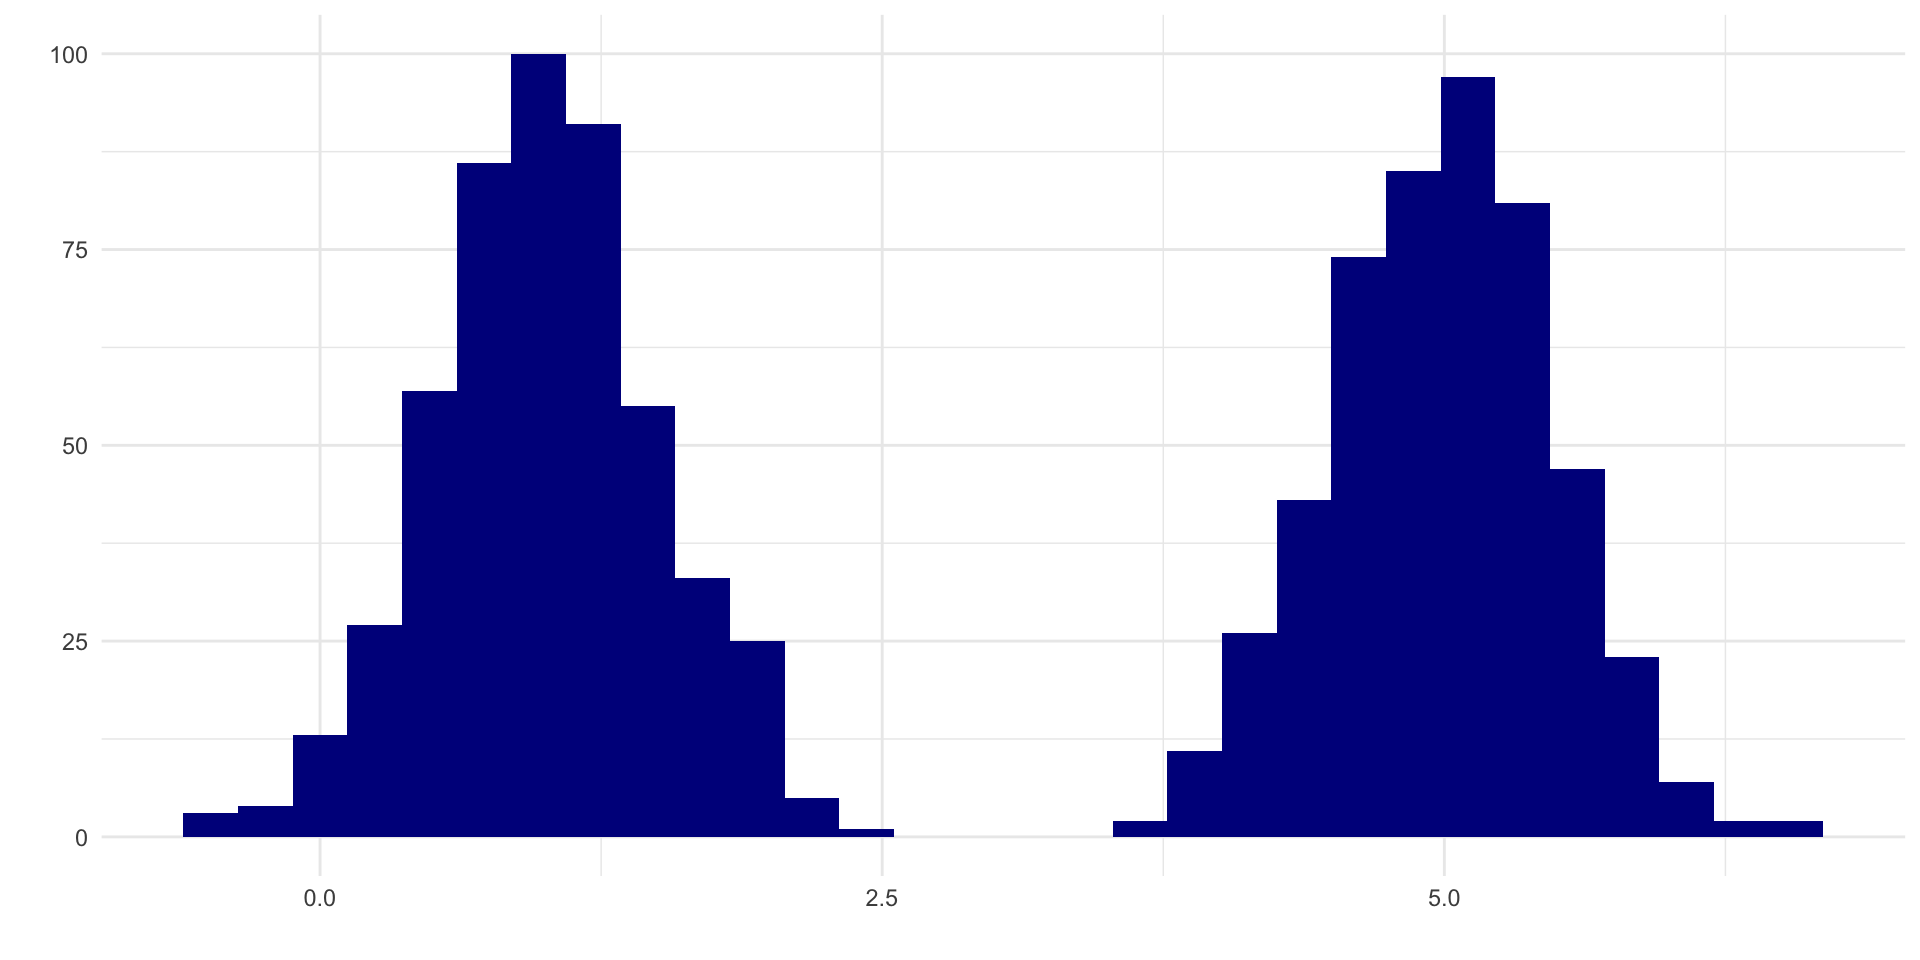
Central Limit Theorem
The Galton Board
Measures of Central tendency
When should we use the median…
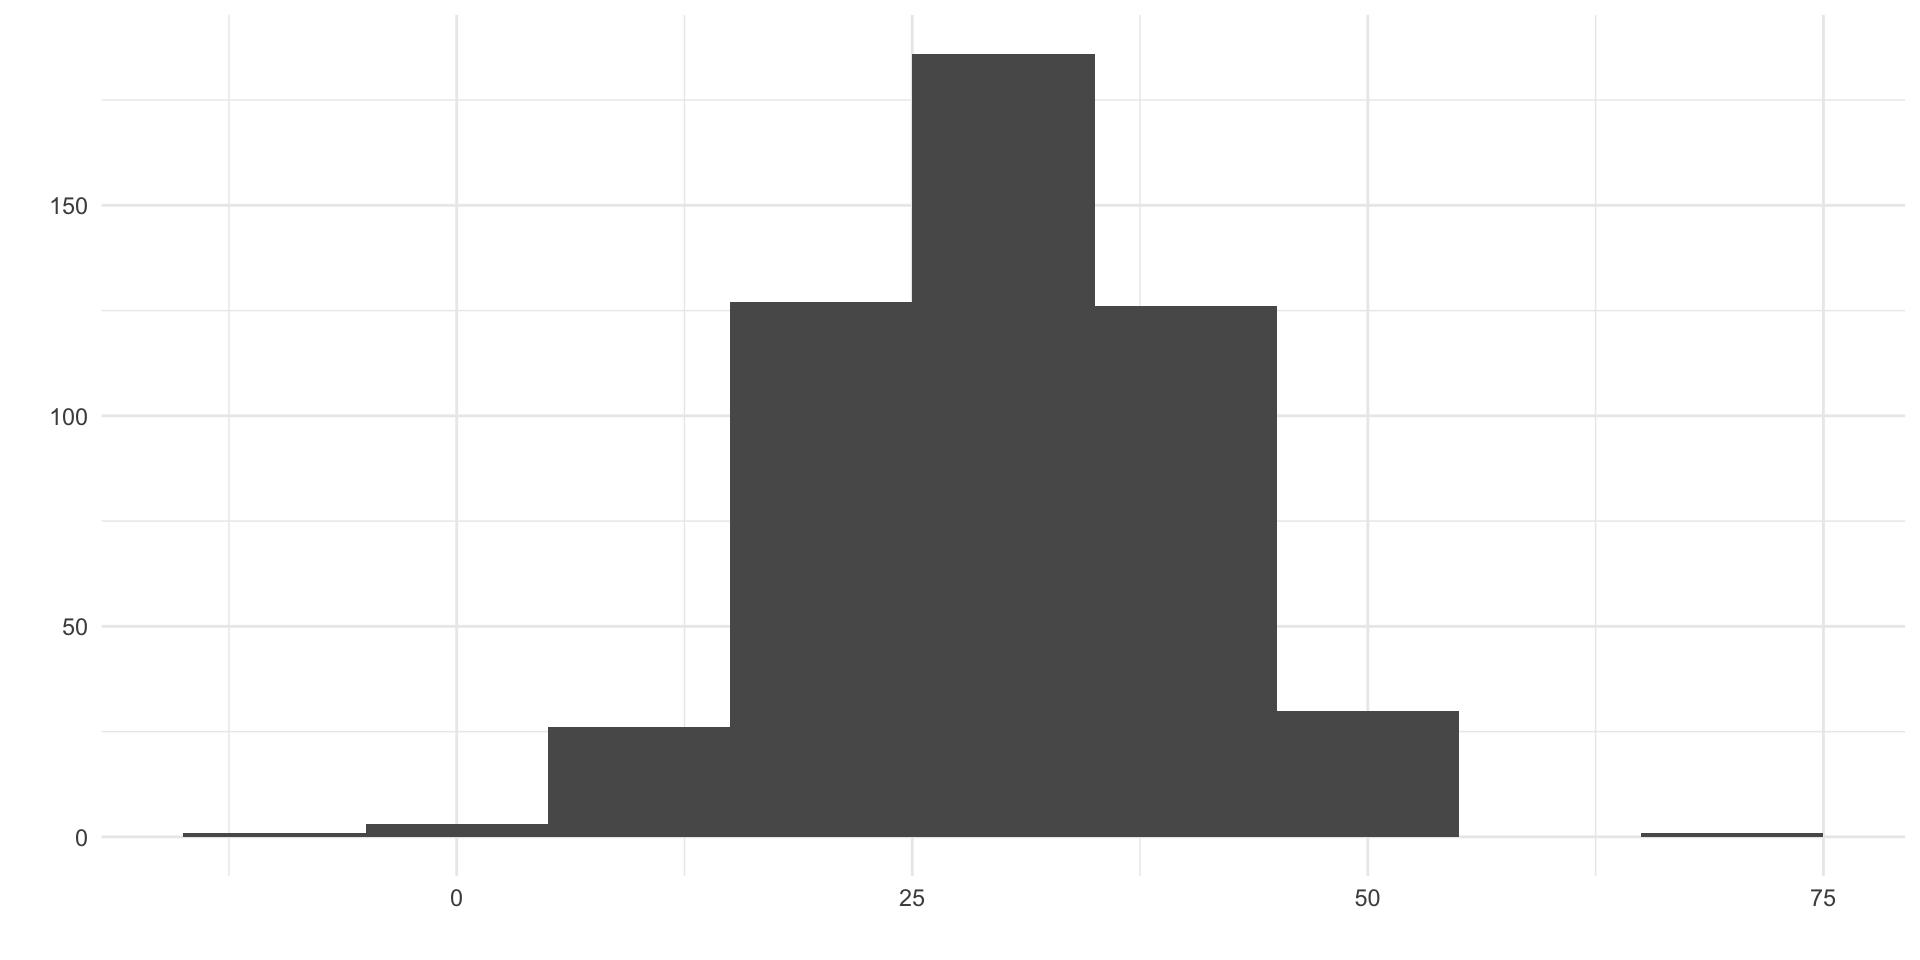
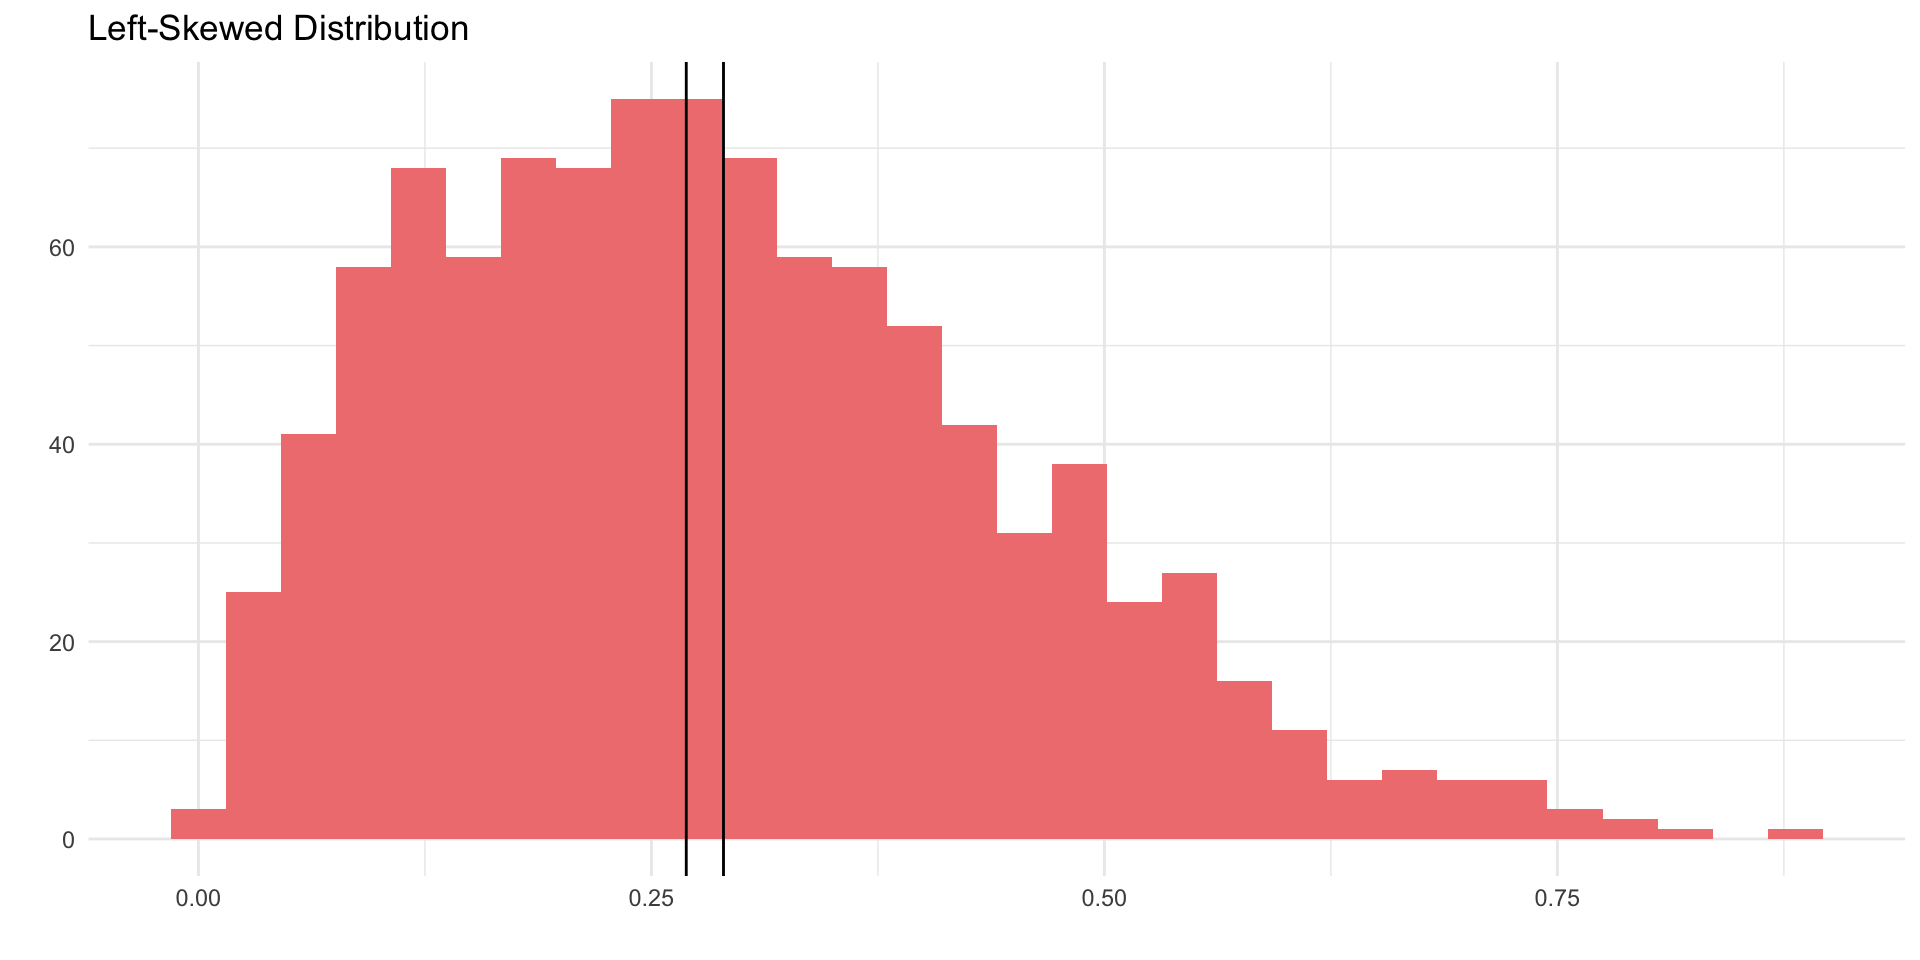
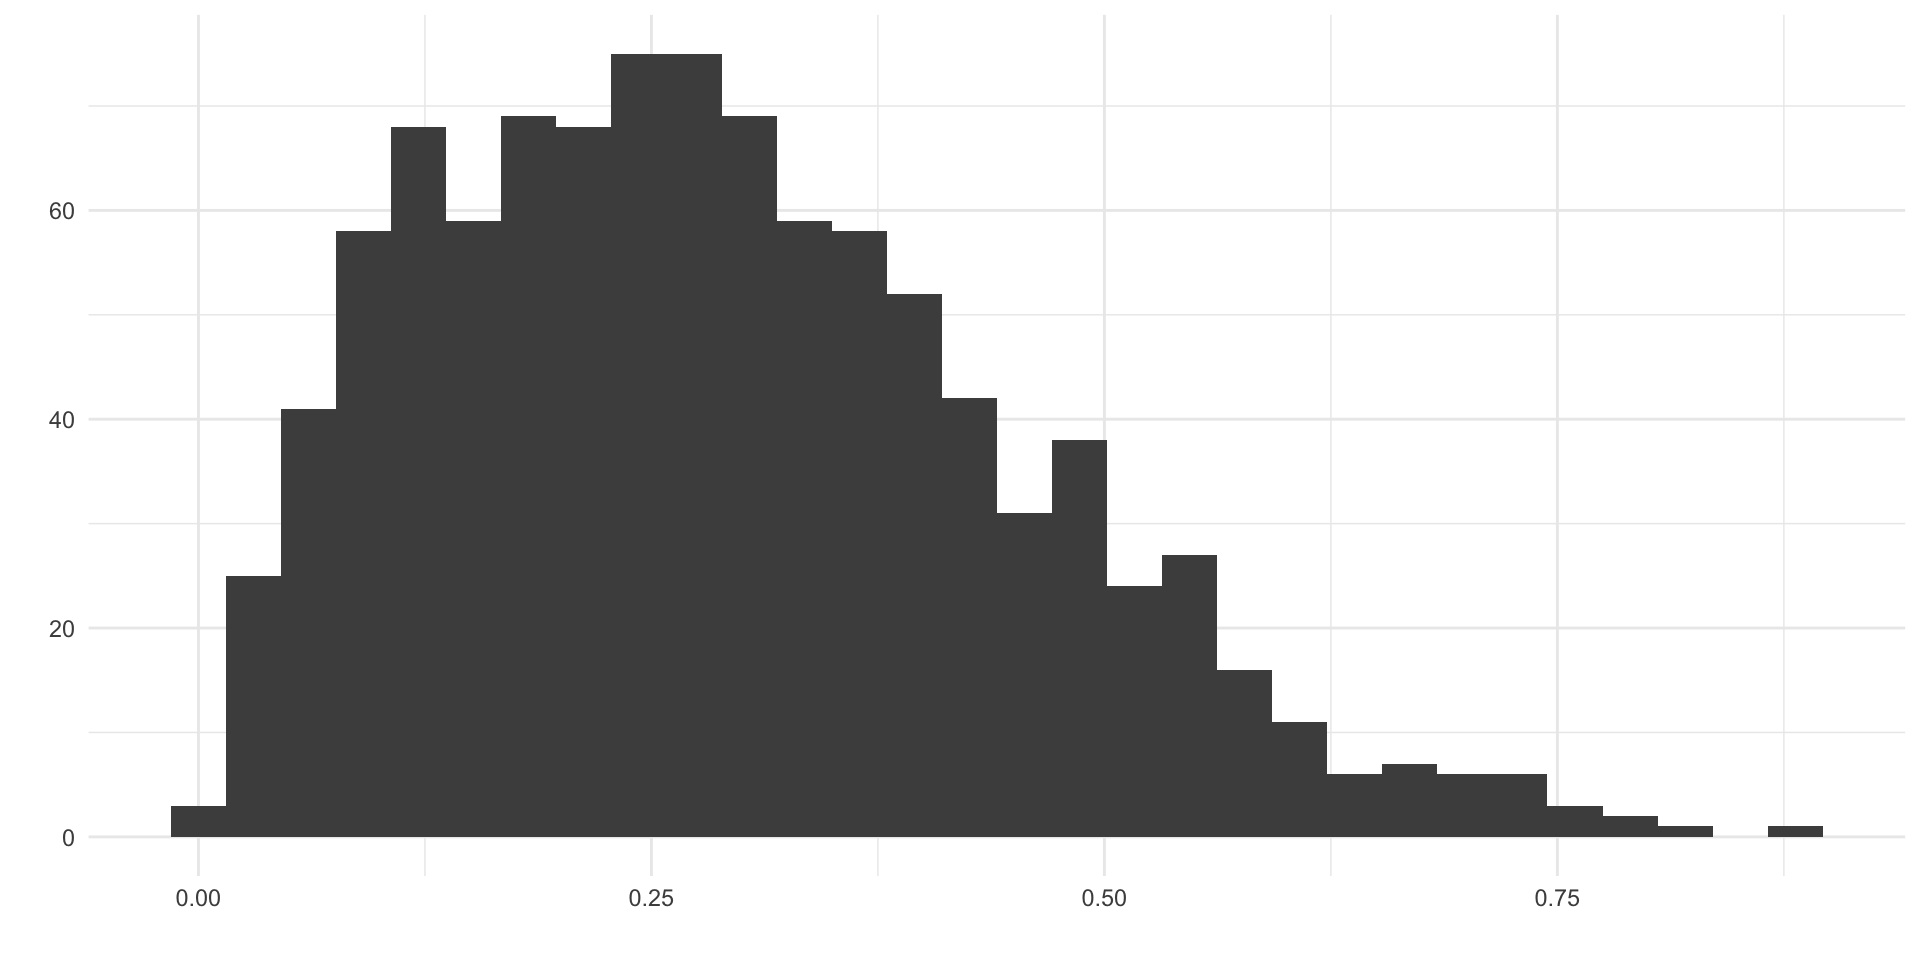
A skewed distribution occurs when one side of the data gets cut off due to measurement limitation.
In a skewed distribution, the mean gets pulled out toward the tail, and the mode gets pulled to the cluster.
The median is the best measure of central tendency for skewed distributions because it tells us how most people answered.
Measures of Central tendency
The Mode
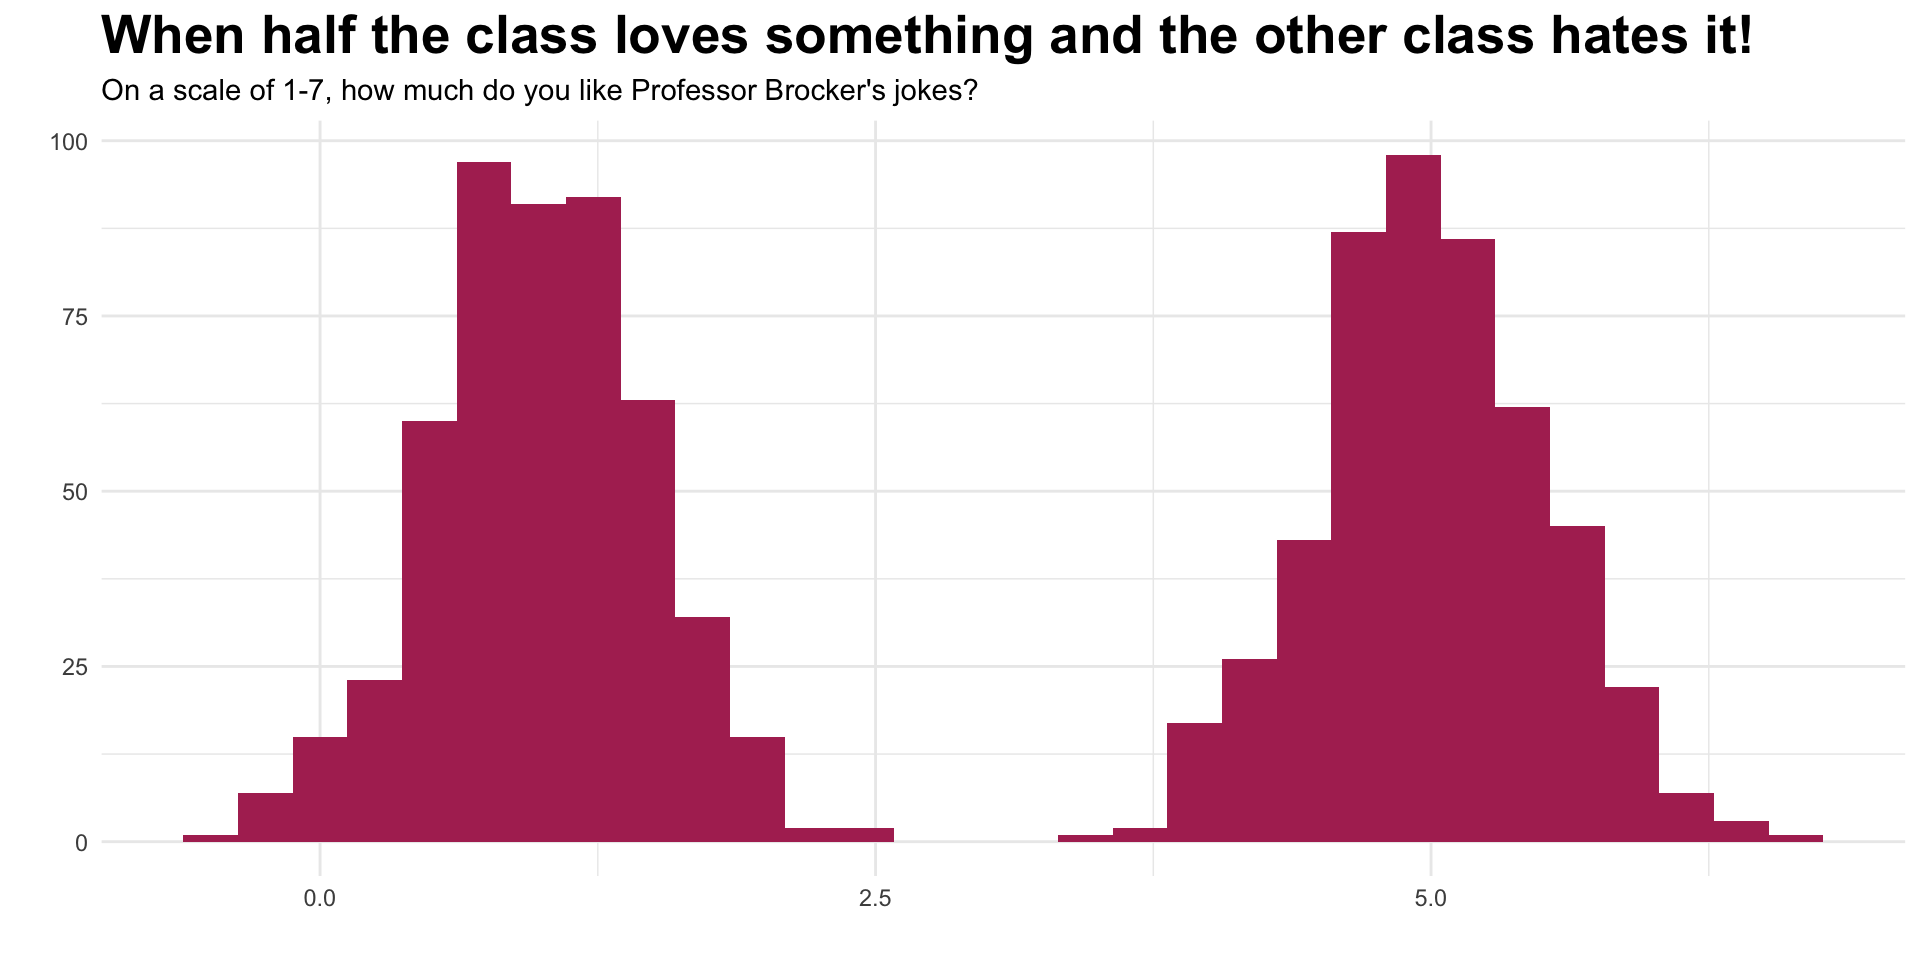
The mode is good for bi-or-tri-modal distributions.
When might you have a bi-modal distribution?
Measures of Central Tendency
Example: Mode
When should we use…
Mean
- good for normal distributions
Median
- good for skewed distributions
Mode
- good for bi-modal distributions
Central Tendency
Which should we use?
Central Tendency
Which should we use?
Central Tendency:
Which should we use?
Calculating measures of central Tendency
Calculating The mean
Tip
- Sum all x values
- Divide by the number of x values (n).
- \(\large{x = 4,2,5,6}\)
- \(\large{\frac{\sum(x)}{n}}\)
- \(\large{\sum(x) = 4 + 2 + 5 + 6 = 17}\)
- \(\large{\frac{17}{4} = \color{red}{4.25}}\)
Calculating measures of central Tendency
Calculating The median
Tip
- Put all x values in order from smallest or largest or largest to smallest.
- Find the middle number.
- If there are an even number of x values, take the average of the 2 middle numbers.
- \(\large{x = \{6,2,4,2,8\}}\)
- \(\large{x = \{2,2,4,6,8\}}\)
- \(\large{x = \{2,2,\color{blue}{4},6,8\}}\)
Calculating measures of central tendency
Calculating The mode
Tip
- Put all x values in order from smallest or largest or largest to smallest.
- Find the number or numbers that repeat the most.
- \(\large{x = [3,2,1,5,3,7,8,3,2,4,1]}\)
- \(\large{x = [1,1,2,2,\color{green}{3},\color{green}{3},\color{green}{3},4,5,7,8]}\)
- There can be more than 1 mode.
Using Excel
Excel Practice
What does each row in this spreadsheet represent?
What does each column in this spreadsheet represent?
Excel Practice
Adding & Sum:
SUM(B2:B10)Subtracting:
=C9 - C2Multiplying:
=B12 * 4Dividing:
=A2/B3Squaring:
=(B2-C2)^2Average:
=AVERAGE(B2:B20)
Excel Practice
Calculate the Mean
Using
=SUM(x)/nUsing
=AVERAGE(x)Calculate the Median
Find the
Mode(s)
Review
When do we use the and how do we caluclate the…
Mean?
Median?
Mode?
Key Takeaways Slide
Mean → good for symmetric/normal.
Median → good for skewed/outlier-heavy.
Mode → good for categorical or multi-modal
We assume normality because it lets us use the mean.
⬡⬡⬡