bar_chart scatter_plot show_chart pie_chart table_chart insert_chart
Data Visualization
PSY 348: Lecture 2
Dave Brocker
brockeda@farmingdale.edu
Farmingdale State College
Last time: statistics isn’t just math — it’s how you make sense of decisions you already make every day.

smartphone

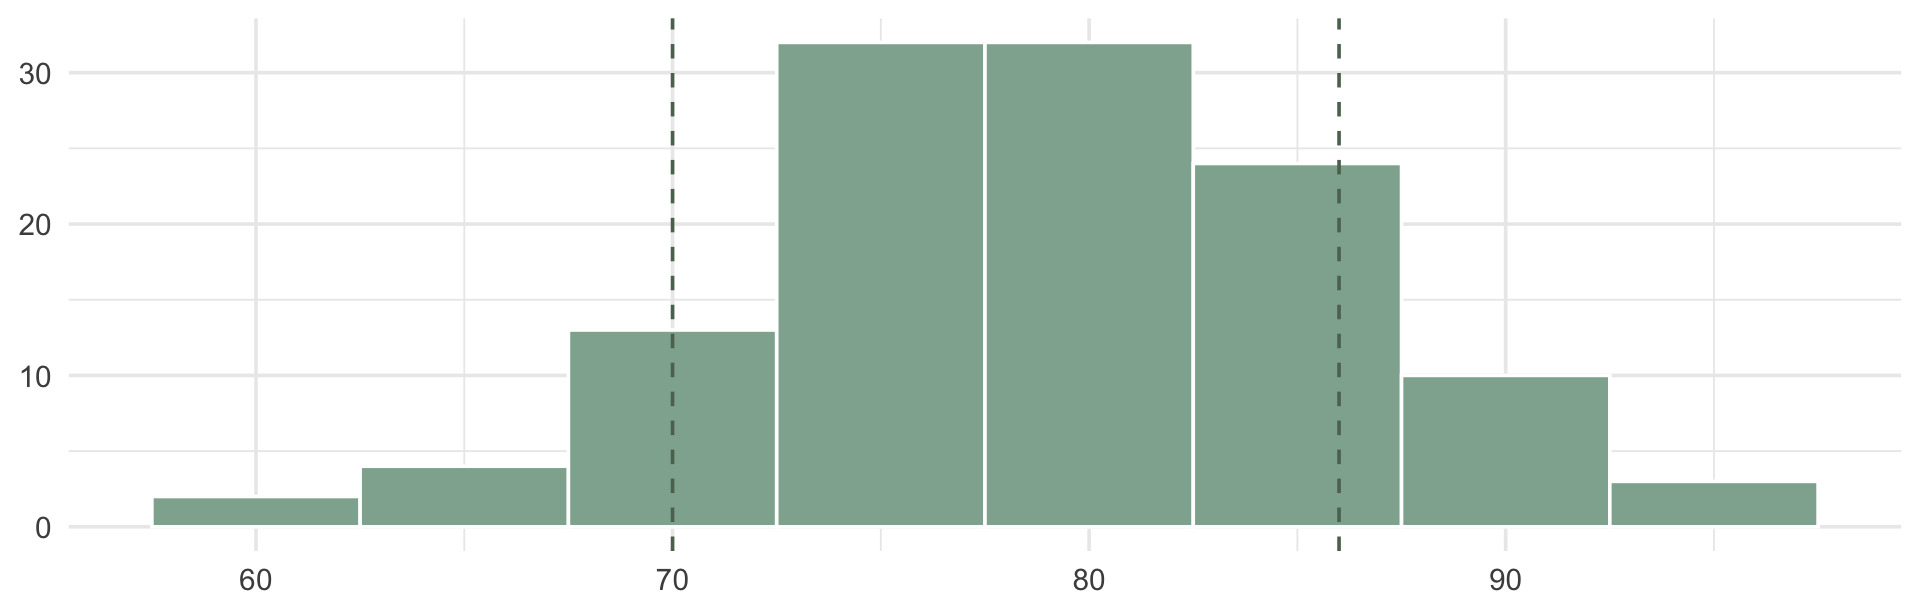
The average was 78. You scored a 67.
Today: choosing and building the right picture for your data.
Consider these two ways of showing the same information:
Option A
78
(SD = 8)
Option B

Both are “true.” Only one of them lets you see the students who didn’t fit the average.
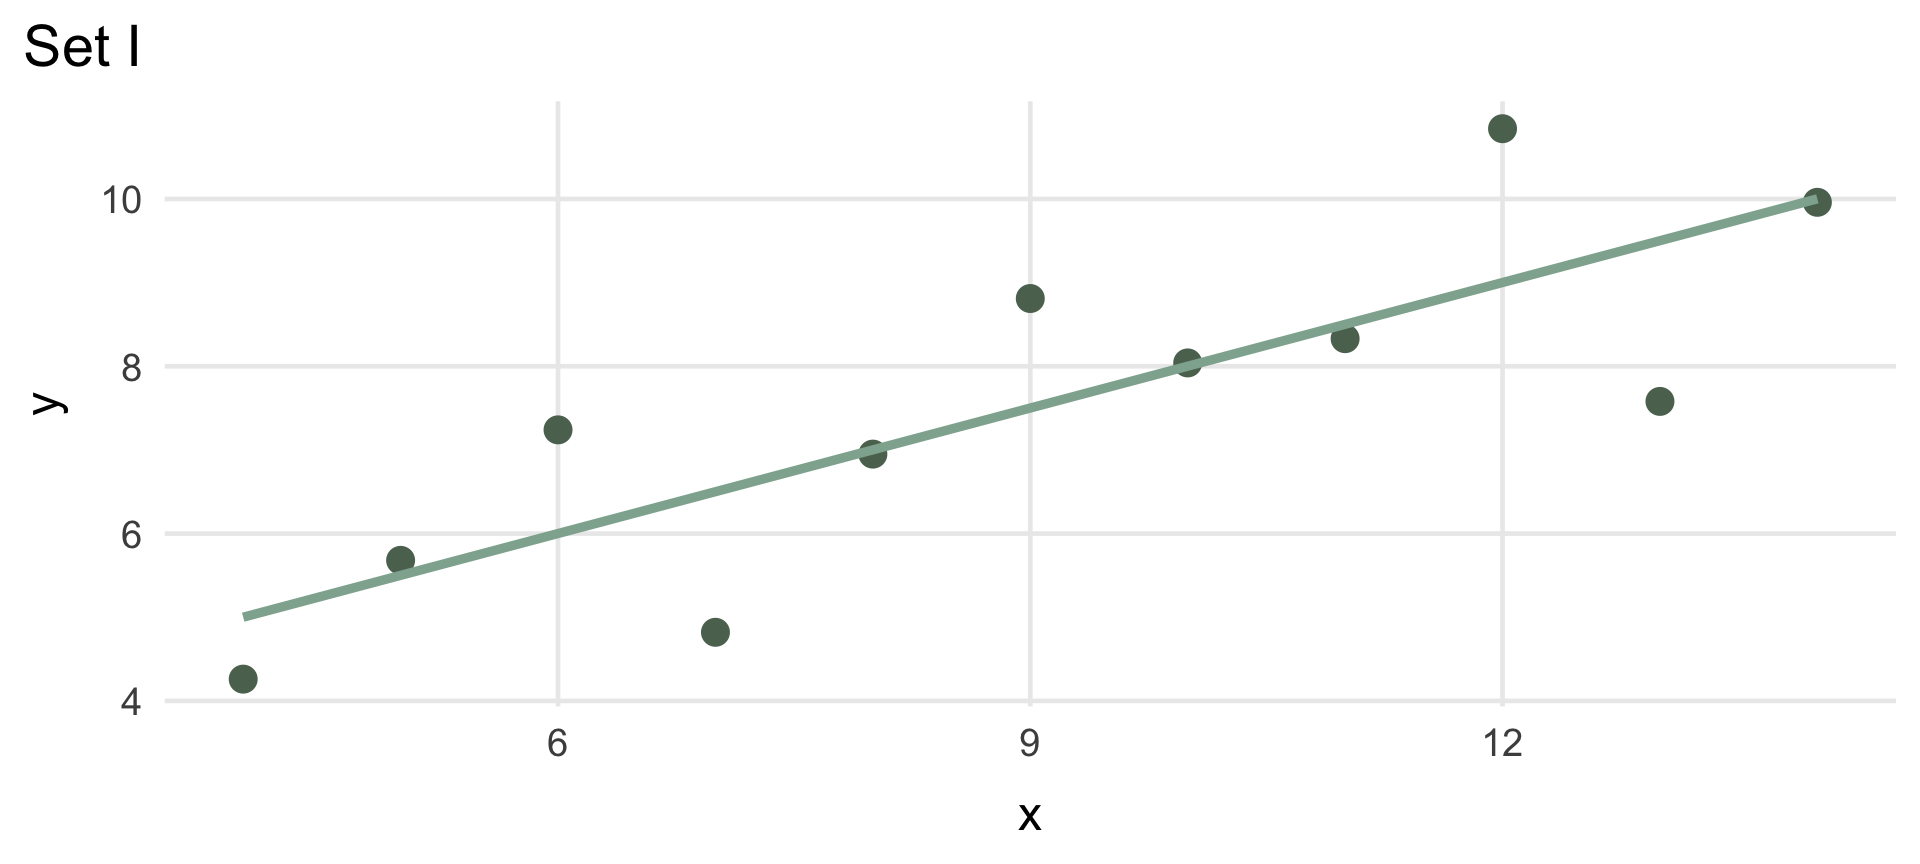
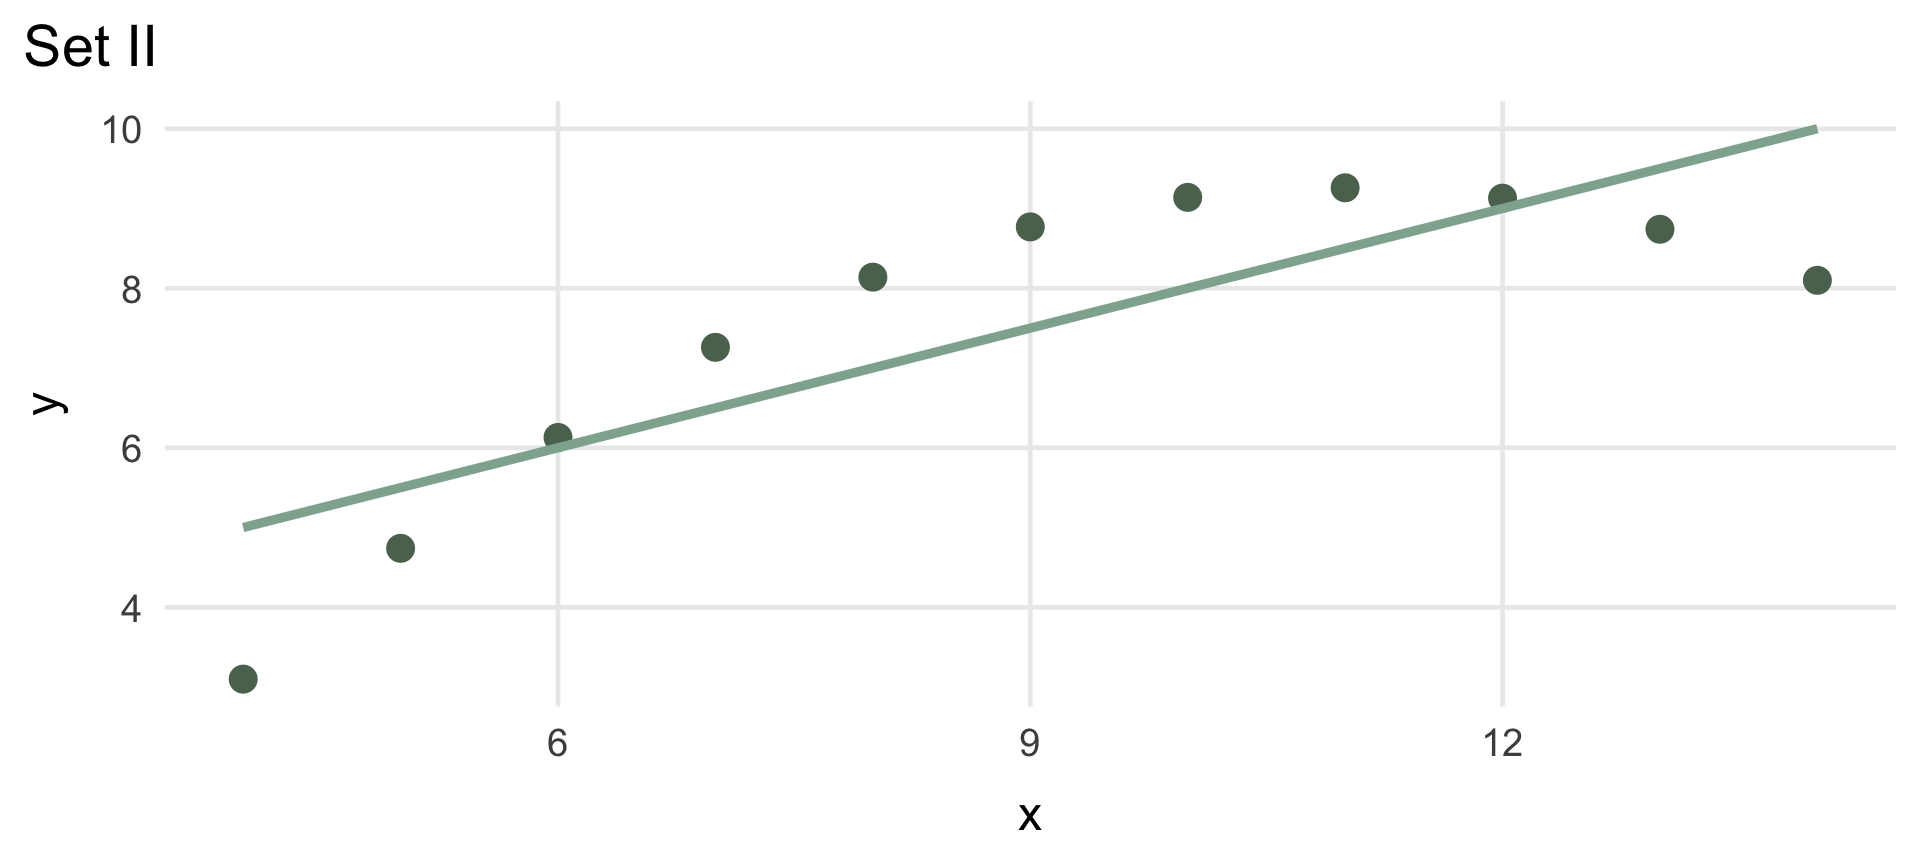
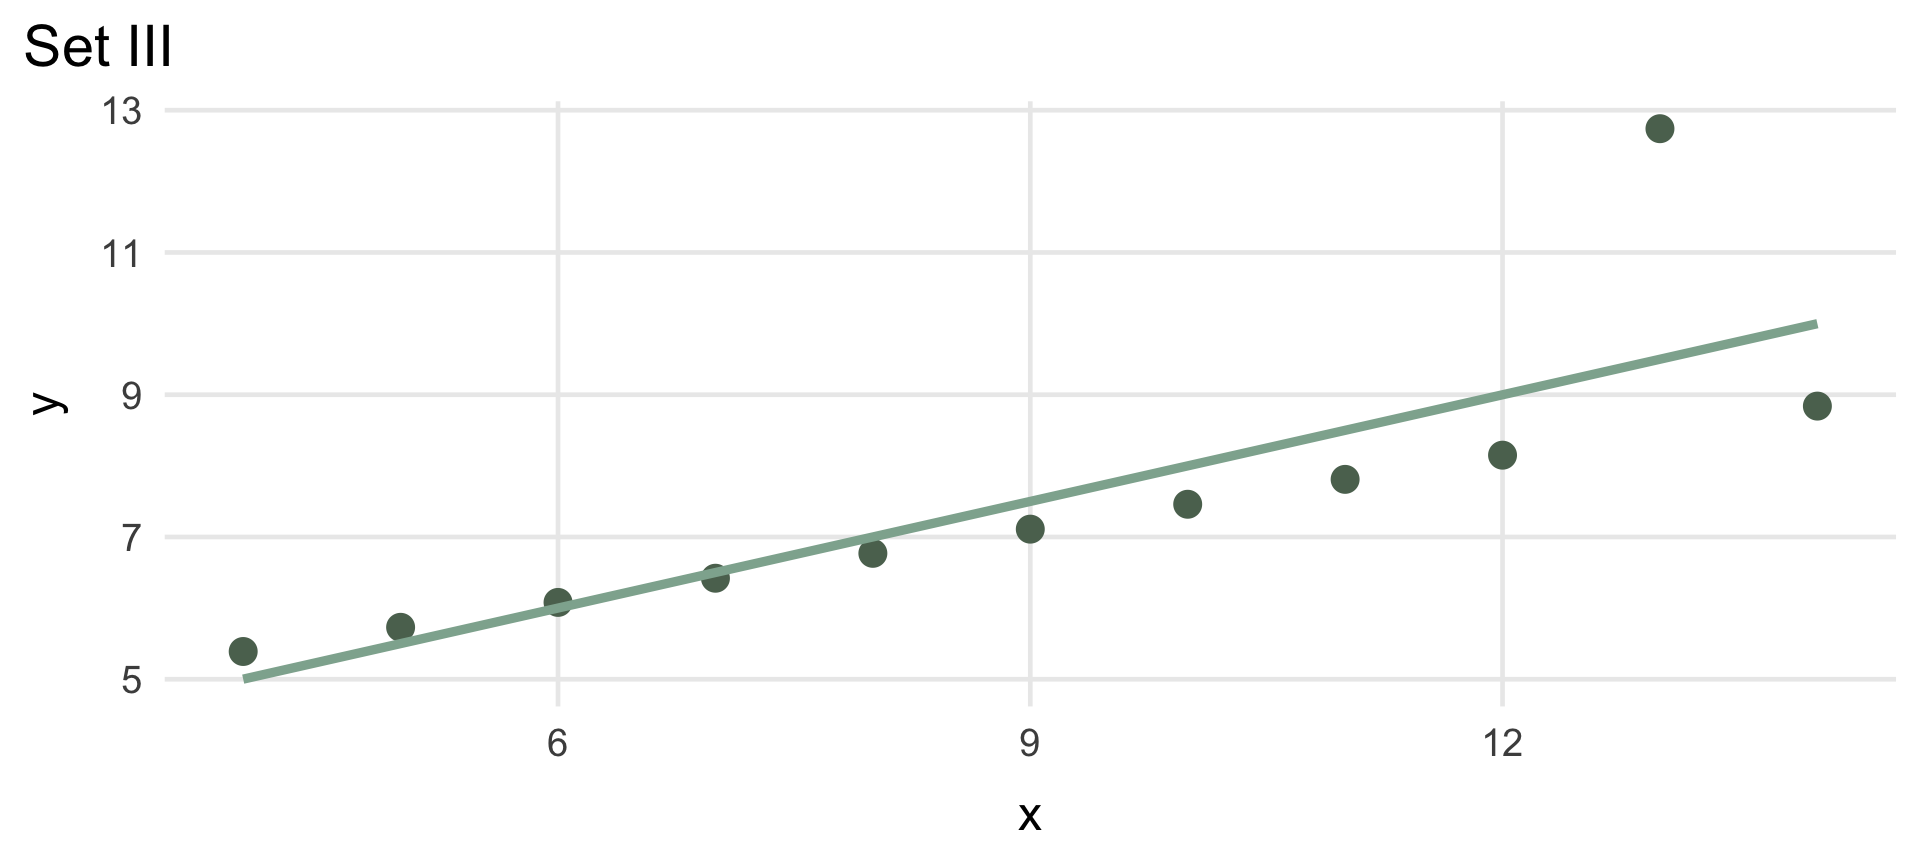
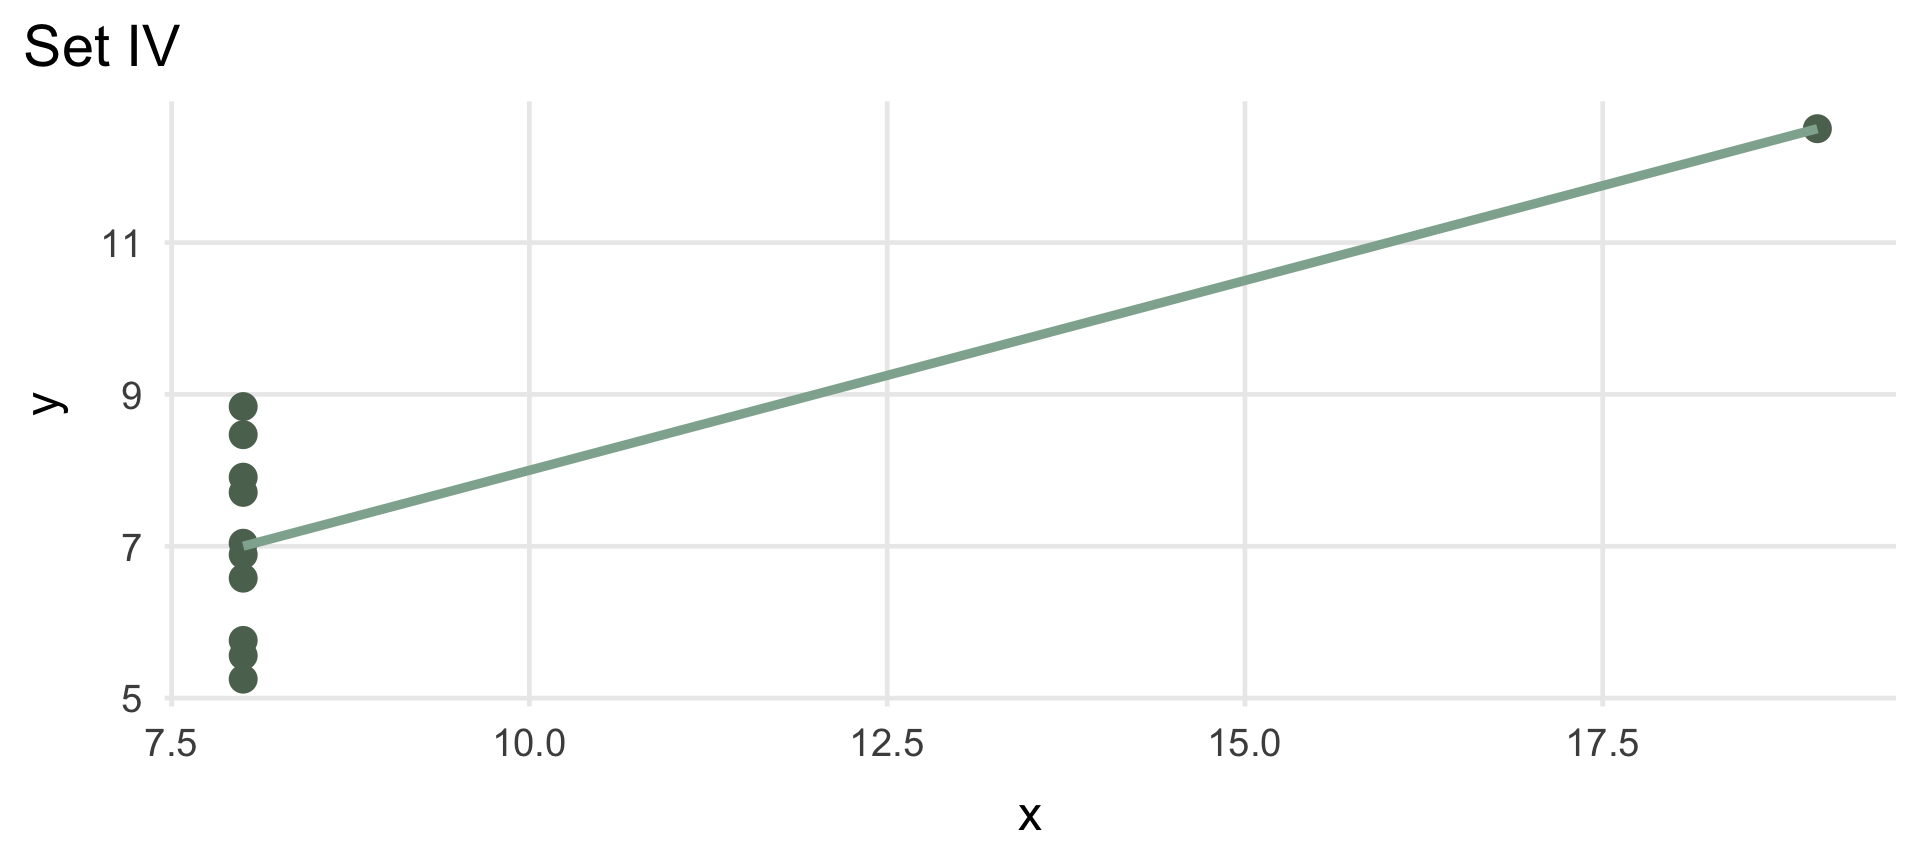
These four datasets have (essentially) identical descriptive statistics:
| Anscombe's Quartet: Identical Summary Statistics | |||||
| Mean (x) | Mean (y) | SD (x) | SD (y) | Correlation | |
|---|---|---|---|---|---|
| I | 9 | 7.5 | 3.32 | 2.03 | 0.82 |
| II | 9 | 7.5 | 3.32 | 2.03 | 0.82 |
| III | 9 | 7.5 | 3.32 | 2.03 | 0.82 |
| IV | 9 | 7.5 | 3.32 | 2.03 | 0.82 |
| Anscombe, F. J. (1973). Graphs in statistical analysis. | |||||
Same mean, SD, and correlation in every tab — click through them. Four very different pictures.
Summary statistics (mean, SD, correlation) can hide the actual shape of your data
Outliers, clusters, and non-linear patterns are often invisible in a table of numbers
Always look at the picture — it’s not optional, it’s part of the analysis
| A Quick Decision Guide | ||
| What are you showing? | Best chart | |
|---|---|---|
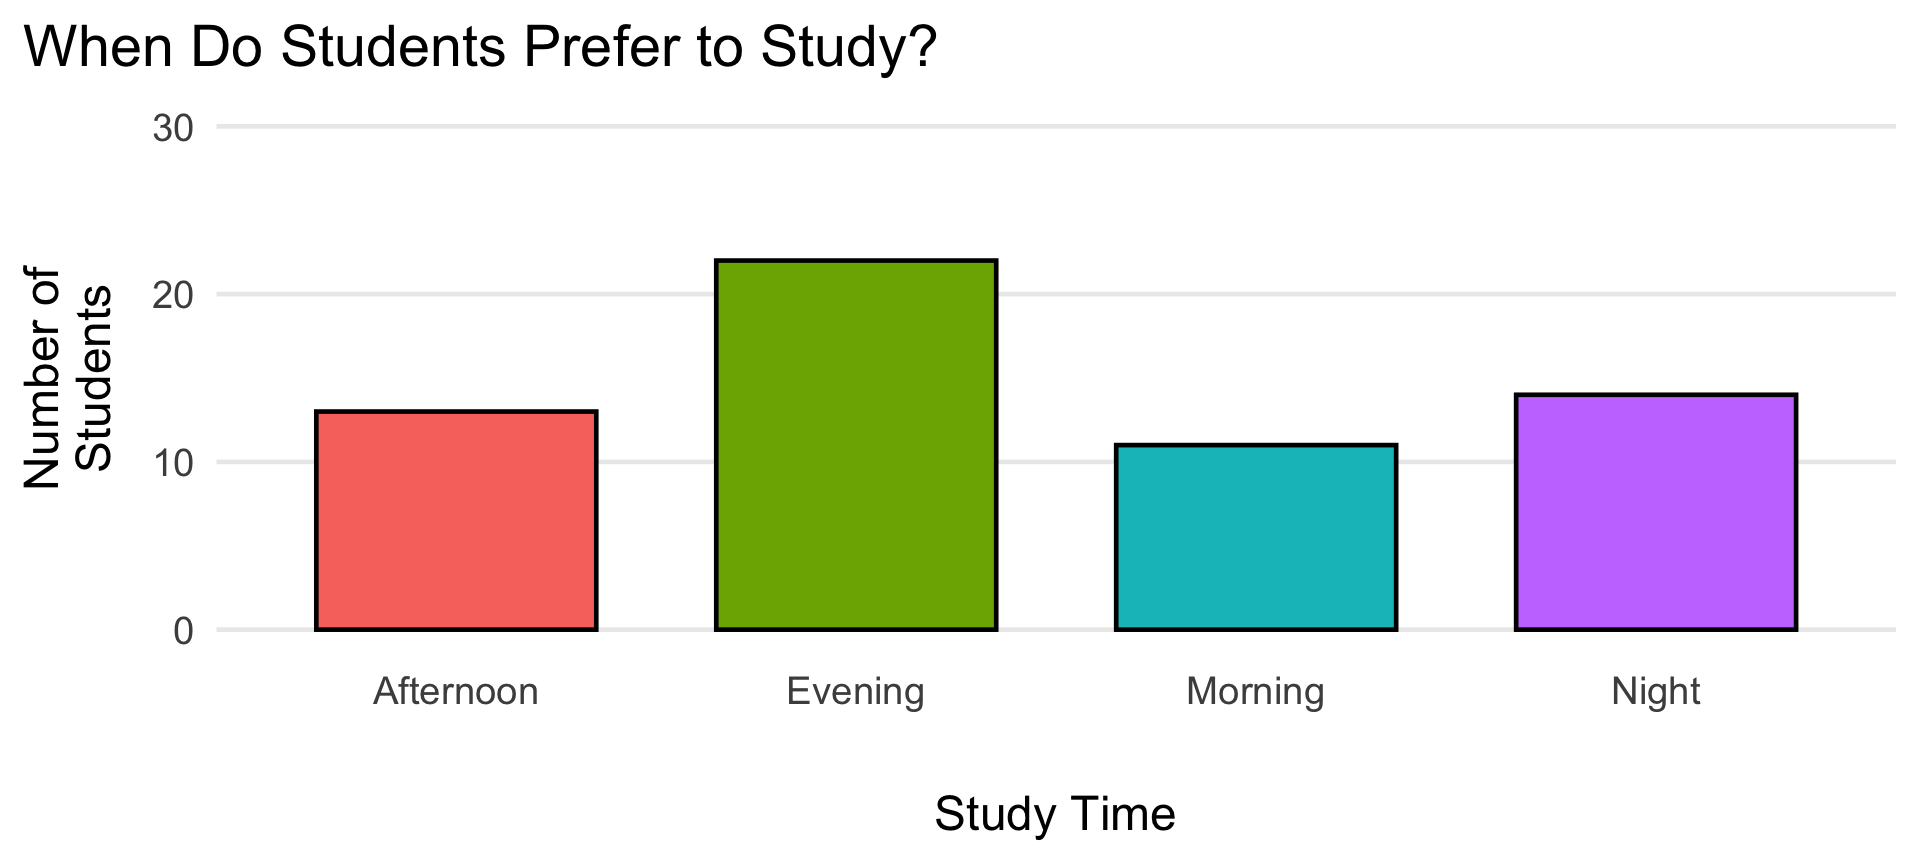
| bar_chart | One categorical variable (counts per group) | Bar chart |
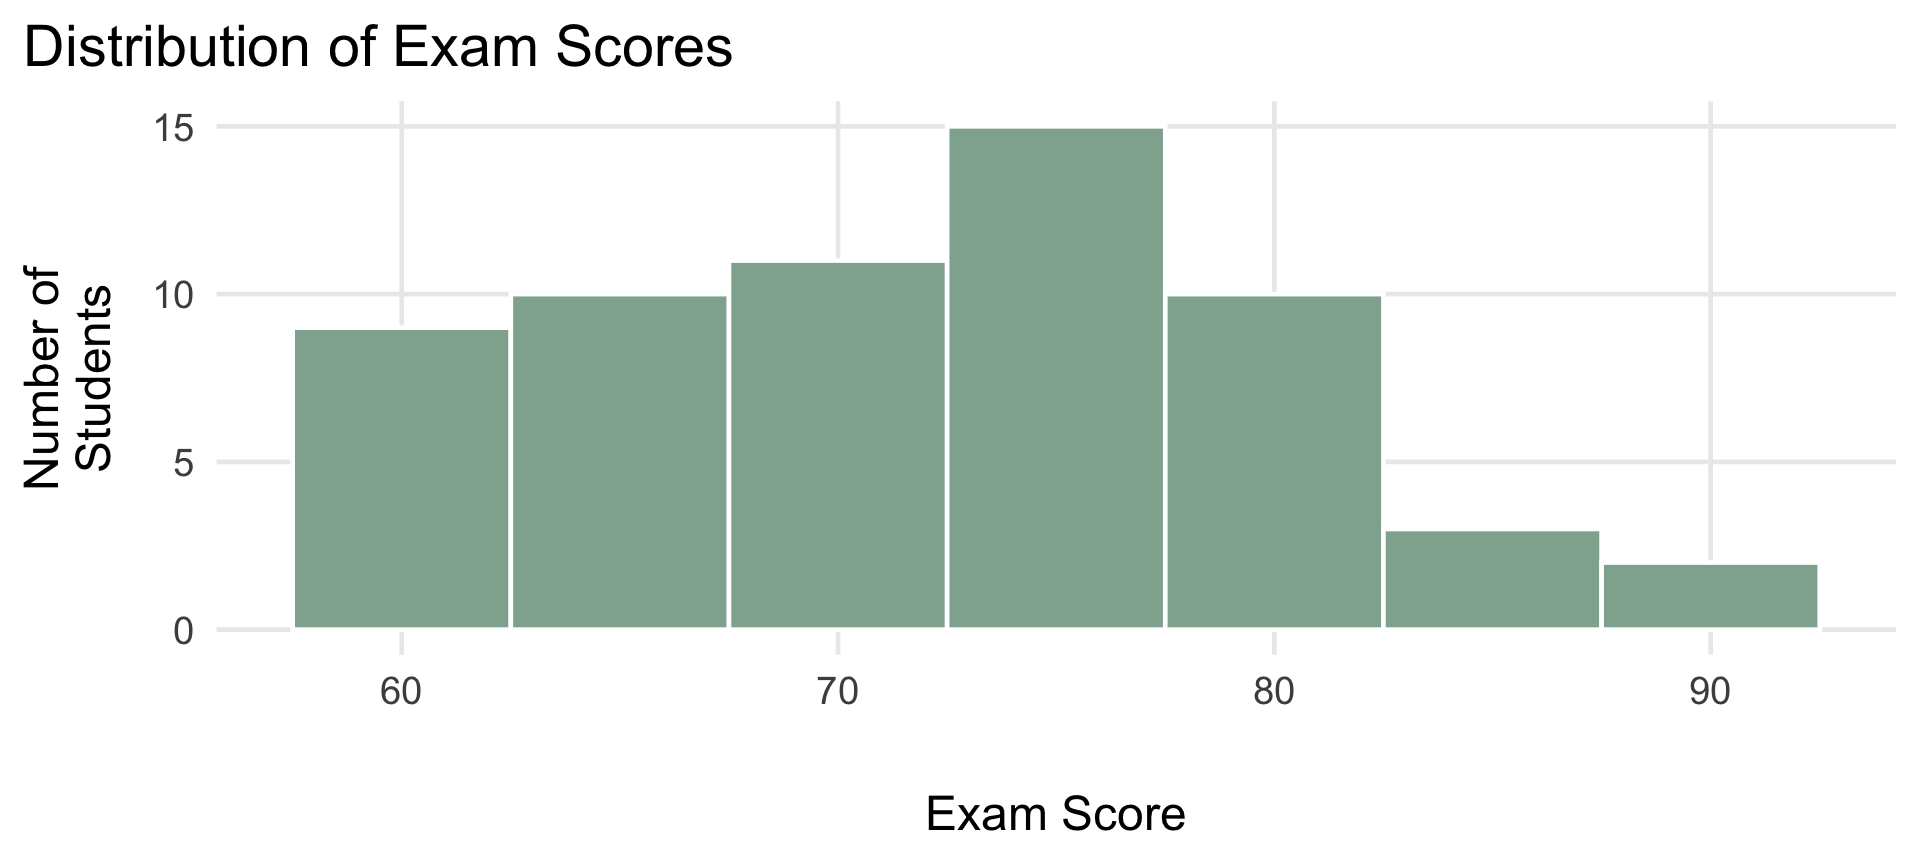
| insert_chart | One continuous variable (its shape/spread) | Histogram or density plot |
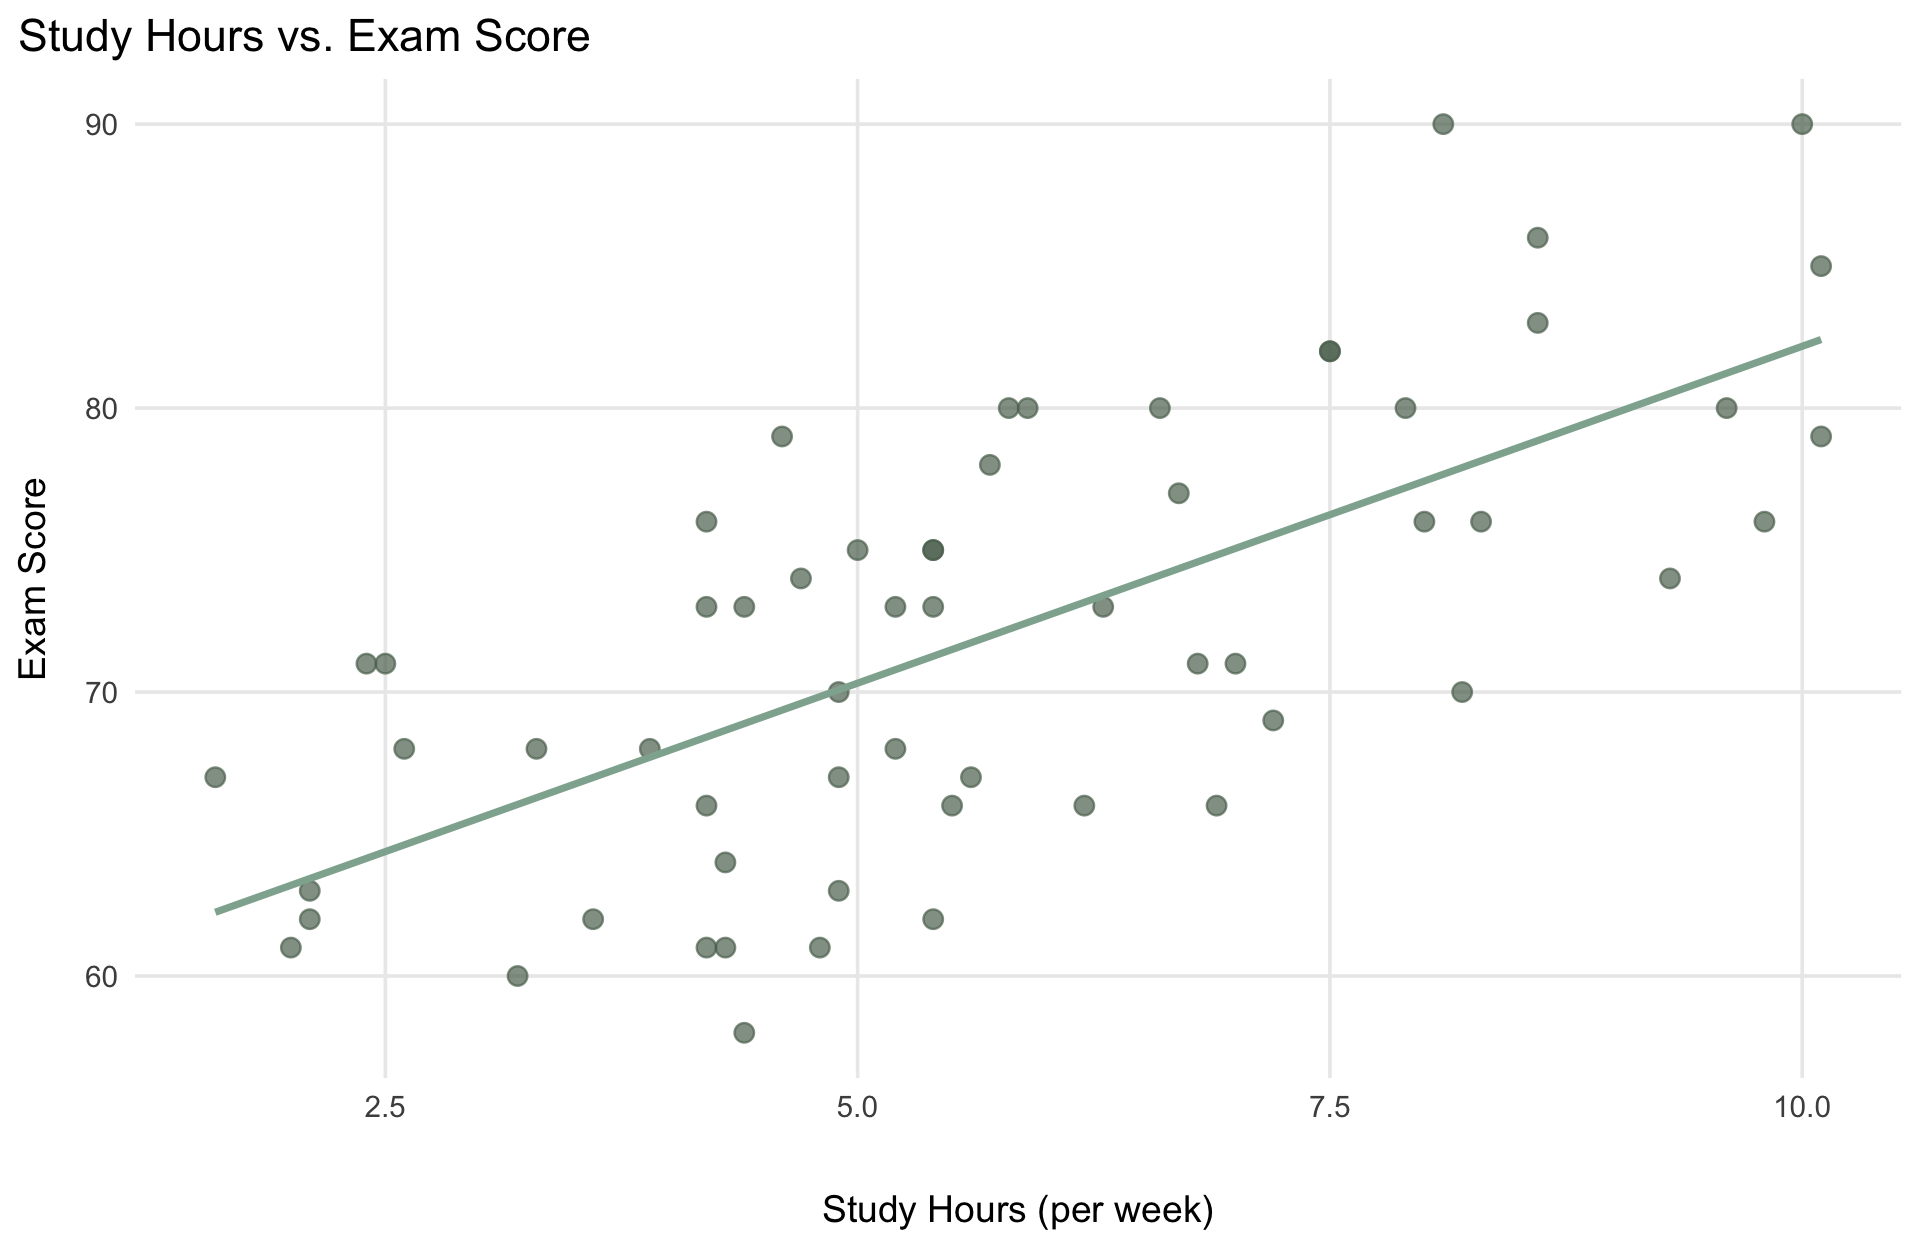
| scatter_plot | Two continuous variables (a relationship) | Scatterplot |
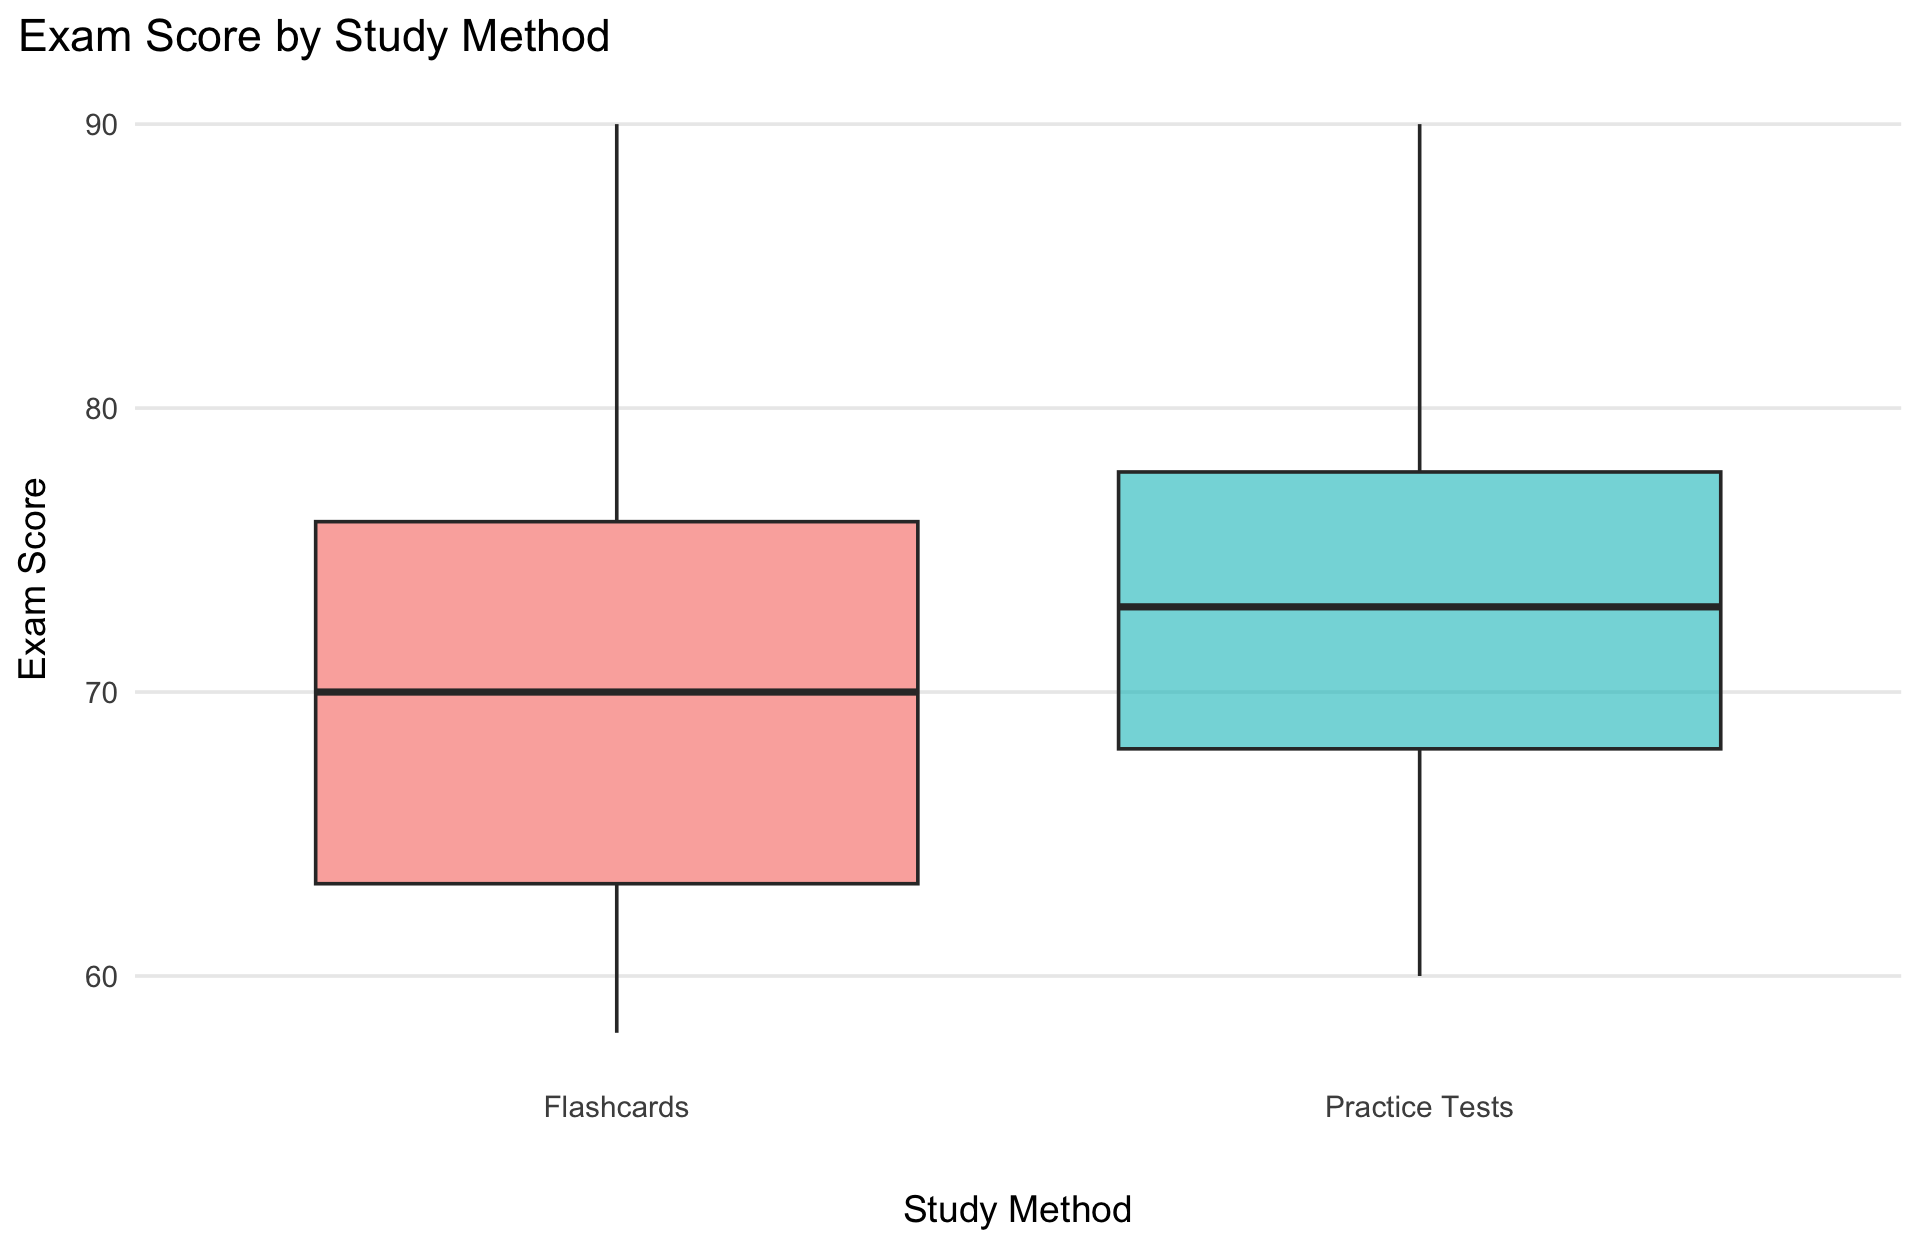
| equalizer | A continuous variable, compared across groups | Box plot |
| show_chart | Change over time | Line chart |
ggplot2 Recipe
Every ggplot2 chart follows the same three-ingredient recipe — we’ll come back to this constantly this semester. It’s ggplot2’s implementation of Wilkinson’s “Grammar of Graphics”: any chart can be built from the same small set of parts.
table_chart
Which tibble/data frame are you plotting?
tune
aes() — which columns map to x, y, color, etc.?
bar_chart
geom_*() — what shape represents your data?
We’ll build up from this simple recipe all semester — no need to memorize every option today.
set.seed(2) # makes the "random" data reproducible every time this renders
students <- tibble(
student = 1:60, # just an ID number
study_time = sample(c("Morning", "Afternoon", "Evening", "Night"), 60,
replace = TRUE, prob = c(0.15, 0.30, 0.35, 0.20)), # categorical variable
study_hours = pmax(round(rnorm(60, mean = 6, sd = 2), 1), 0.5), # continuous variable, floor at 0.5
study_method = rep(c("Flashcards", "Practice Tests"), each = 30), # two even groups
exam_score = pmin(round(55 + 2.5 * study_hours + # score rises with study hours...
ifelse(study_method == "Practice Tests", 4, 0) + # ...gets a small bump from practice tests...
rnorm(60, 0, 5)), 100) # ...plus random noise, capped at 100
)
readr::write_csv(students, "students.csv") # so it can be linked/downloaded below
students |>
slice_head(n = 5) |> # just preview the first 5 rows
gt() |>
tab_header(title = "Example Student Data") |>
opt_row_striping() |>
tab_options(table.font.size = 22, table.width = pct(80)) |>
tab_style(style = cell_text(weight = "bold"), locations = cells_column_labels()) |>
cols_align(align = "center", columns = everything())| Example Student Data | ||||
| student | study_time | study_hours | study_method | exam_score |
|---|---|---|---|---|
| 1 | Evening | 7.5 | Flashcards | 82 |
| 2 | Night | 6.6 | Flashcards | 80 |
| 3 | Afternoon | 8.2 | Flashcards | 70 |
| 4 | Evening | 5.4 | Flashcards | 62 |
| 5 | Morning | 4.4 | Flashcards | 58 |
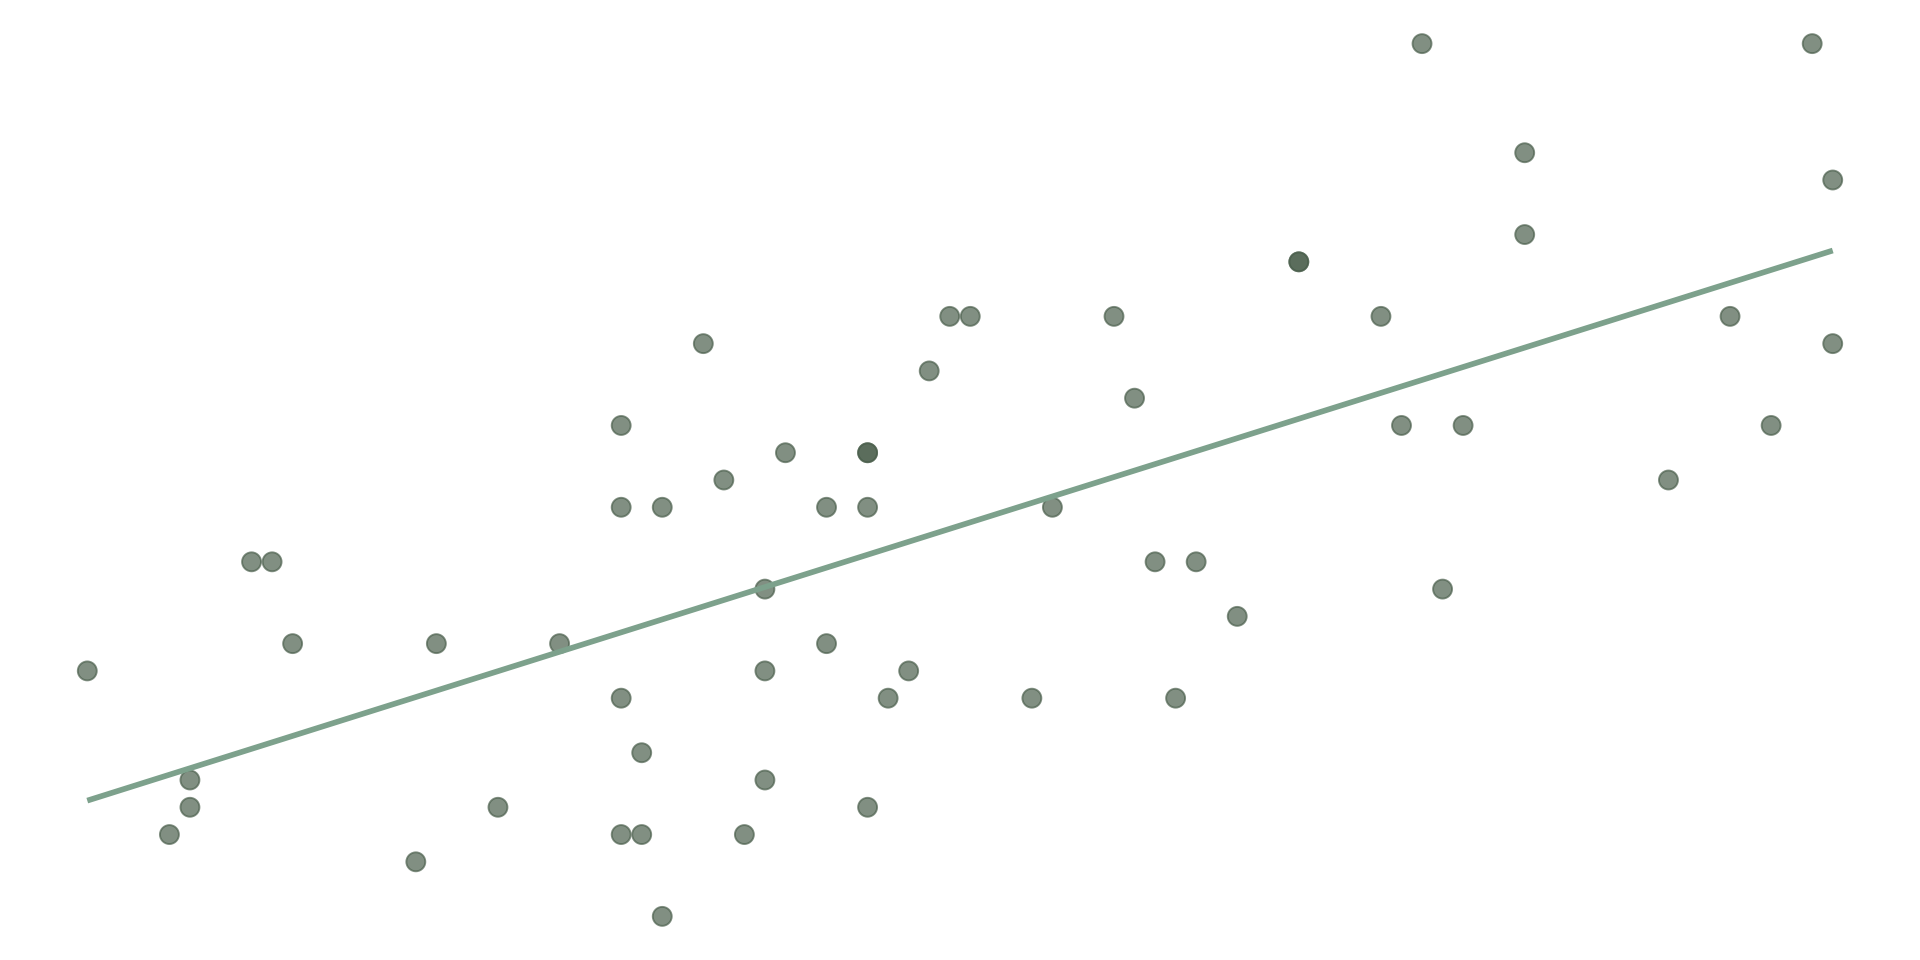
We’ll come back to this exact question — “how strongly are two variables related?” — when we get to correlation.
This is also a preview — “is the difference between these two groups big enough to matter?” is exactly what a later lecture’s t-test answers.
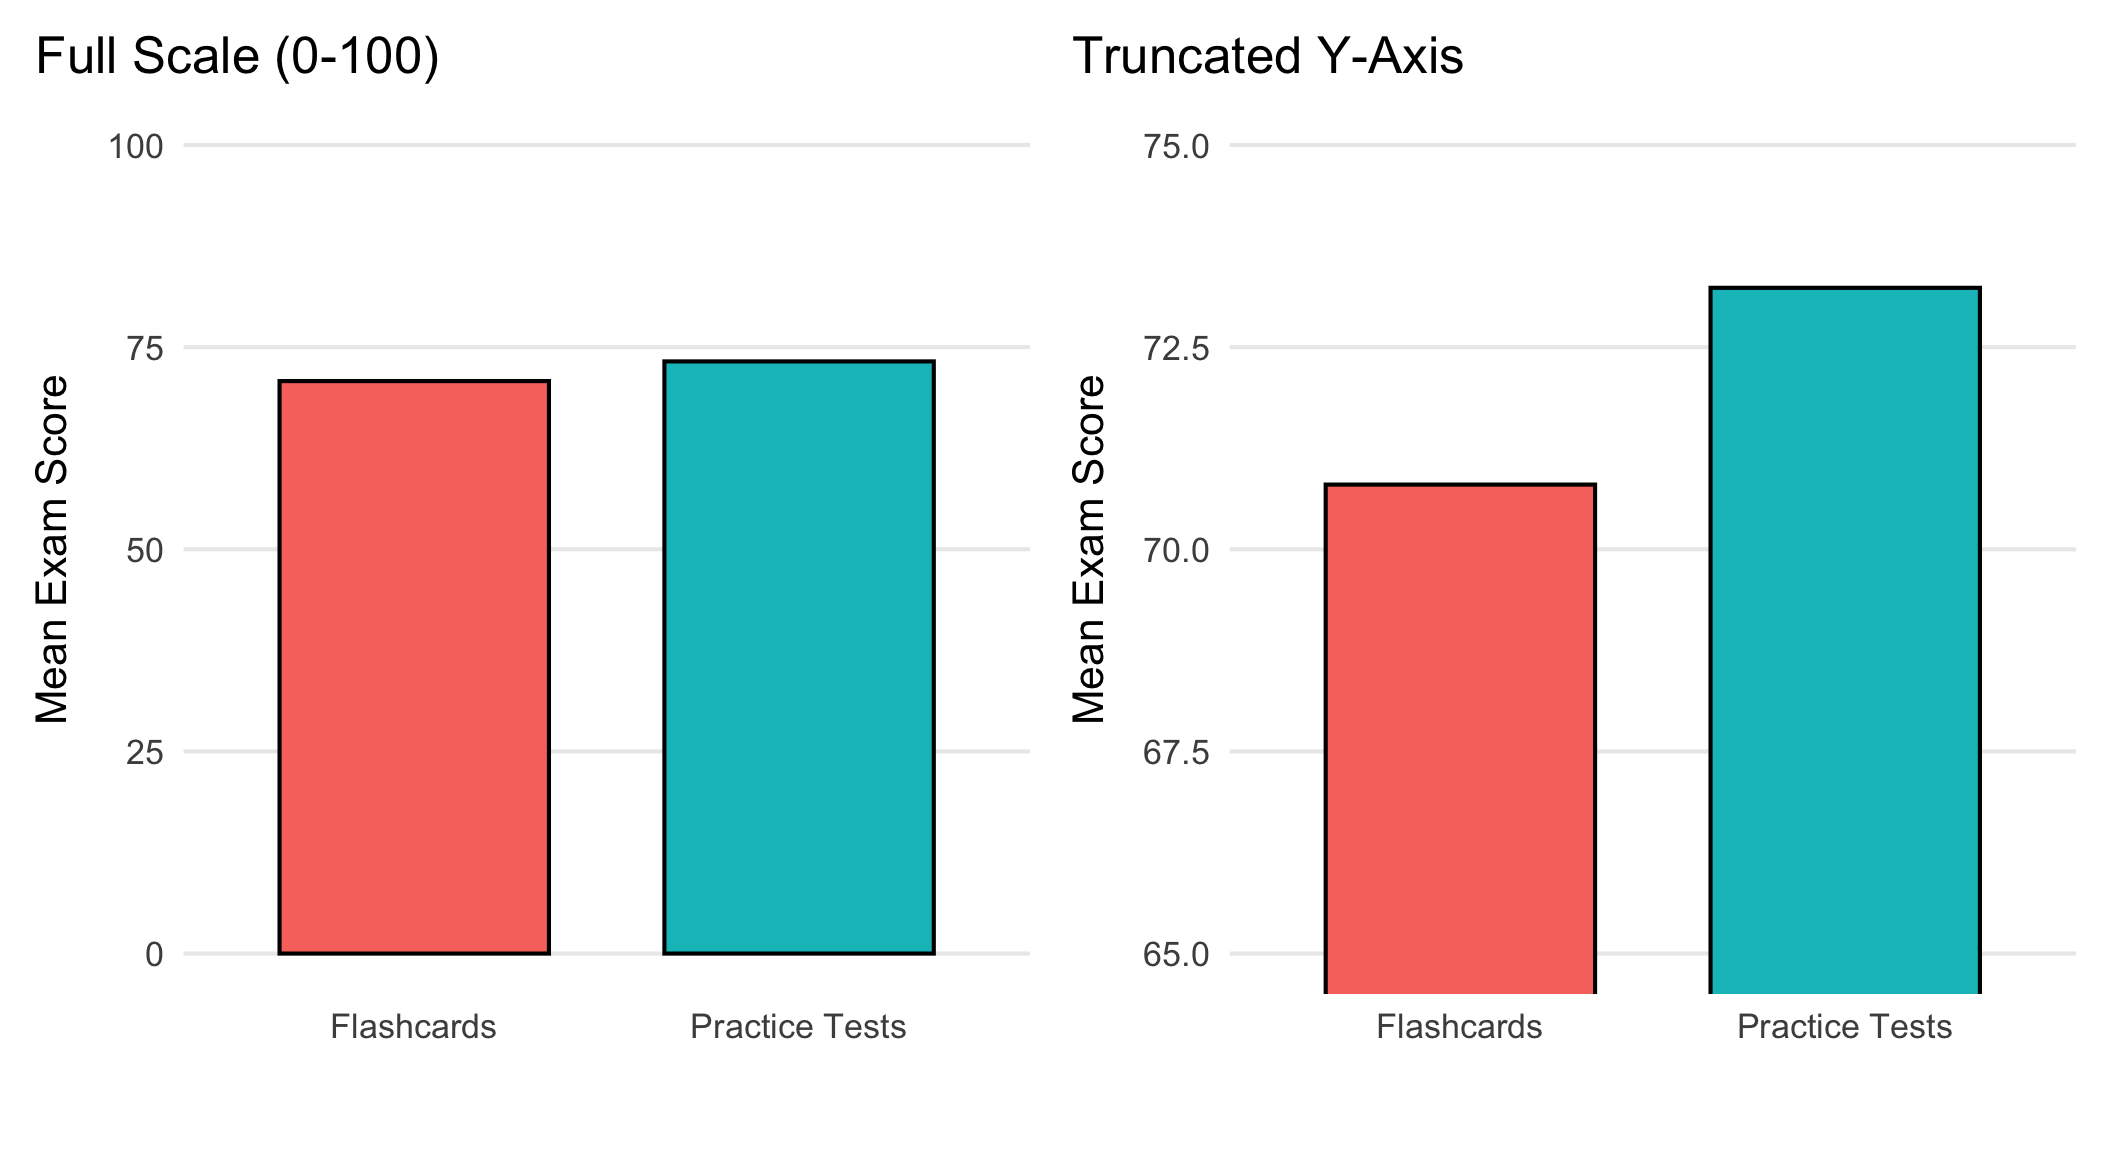
Same exact numbers. The right panel makes a small difference look dramatic — always check where the y-axis starts.
Title — what am I looking at?
Labeled axes — with units, if relevant
An honest scale — start bar charts at 0; don’t cherry-pick a range to exaggerate a difference
Only the elements that add information — no 3D effects, no unnecessary gridlines, no clutter
Fill in the blank
What’s on the x-axis? The y-axis? What relationship is this showing — and what chart type is it?
Fill in the blank
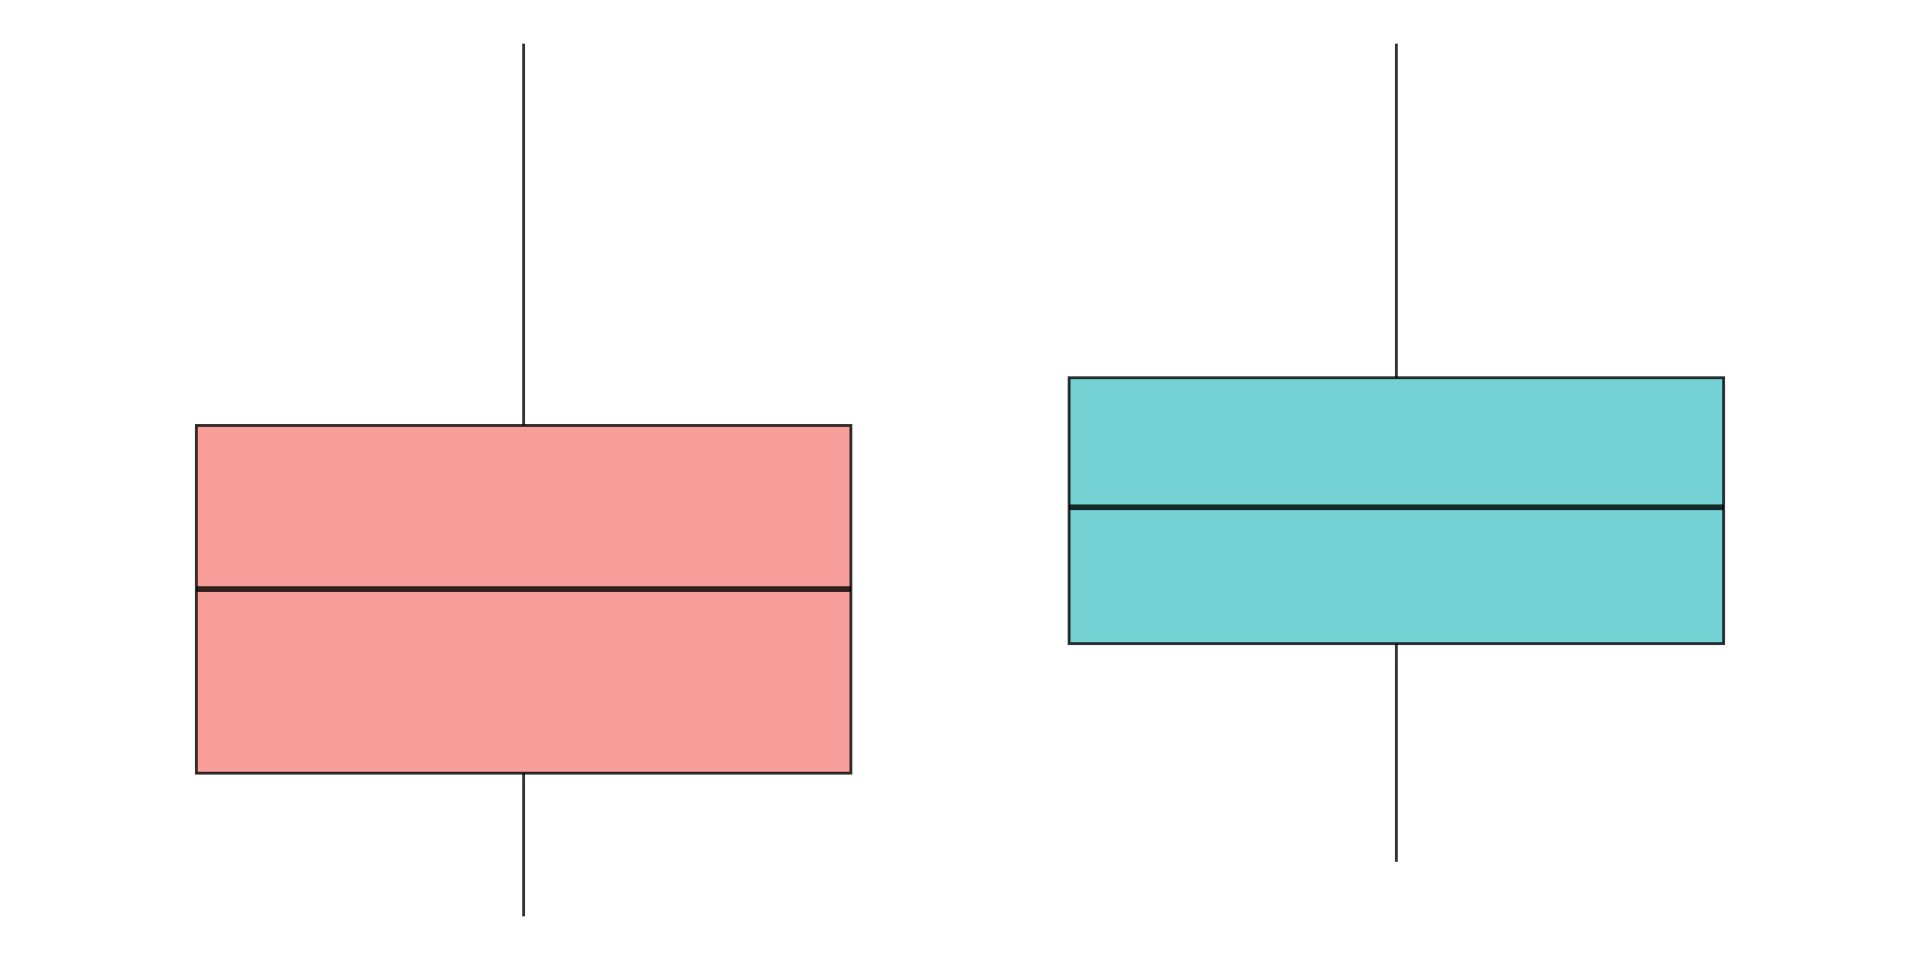
No axis labels this time either — what are the two groups probably being compared, and what does the shape of each box tell you?
A summary statistic can hide the actual shape of your data — that’s why we plot it
You can match a research question to the right chart: one variable vs. two, categorical vs. continuous, one group vs. several
You’ve seen the basic ggplot2 recipe: data + aesthetics + geometry — the “Grammar of Graphics”
You know how to spot (and avoid) a few common ways graphs mislead
Next time: back to describing that shape with numbers — measures of central tendency.
PSY 348 - Statistics for Psychology