Analysis of Variance
Lecture 12
Dave Brocker
Farmingdale State College
Recap
How Did We Get Here?
Recap
How Did We Get Here?
Analysis of Variance
ANOVA
ANOVA, like t-tests, compares the means of different groups to determine if they differ significantly from one another.
ANOVA can examine independent variables with [more than 2 groups].
ANOVA can also be used for just 2 groups.
ANOVA
There are 3 types of ANOVA:
Between subjects
- Different participants are exposed to different levels of the IV
Within subjects (repeated measures ANOVA)
- The same participants are exposed to each level of the IV
Factorial Designs
- Participants experience different levels of one IV and levels of another IV
ANOVA
Between and Within
ANOVA
Factorial (Multiple IV’s)
Between subjects ANOVA
Coffee Example Vol. 2
A researcher wants to see whether it is the taste of coffee that is causing higher levels of happiness. He assigns 30 people to each condition. The experimental group drinks caffeinated coffee. The placebo group drinks decaf. The control group drinks water. All
3groups complete a survey to measure their happiness on a scale of1to10.
Between subjects ANOVA
Coffee Example Vol. 2: Hypotheses
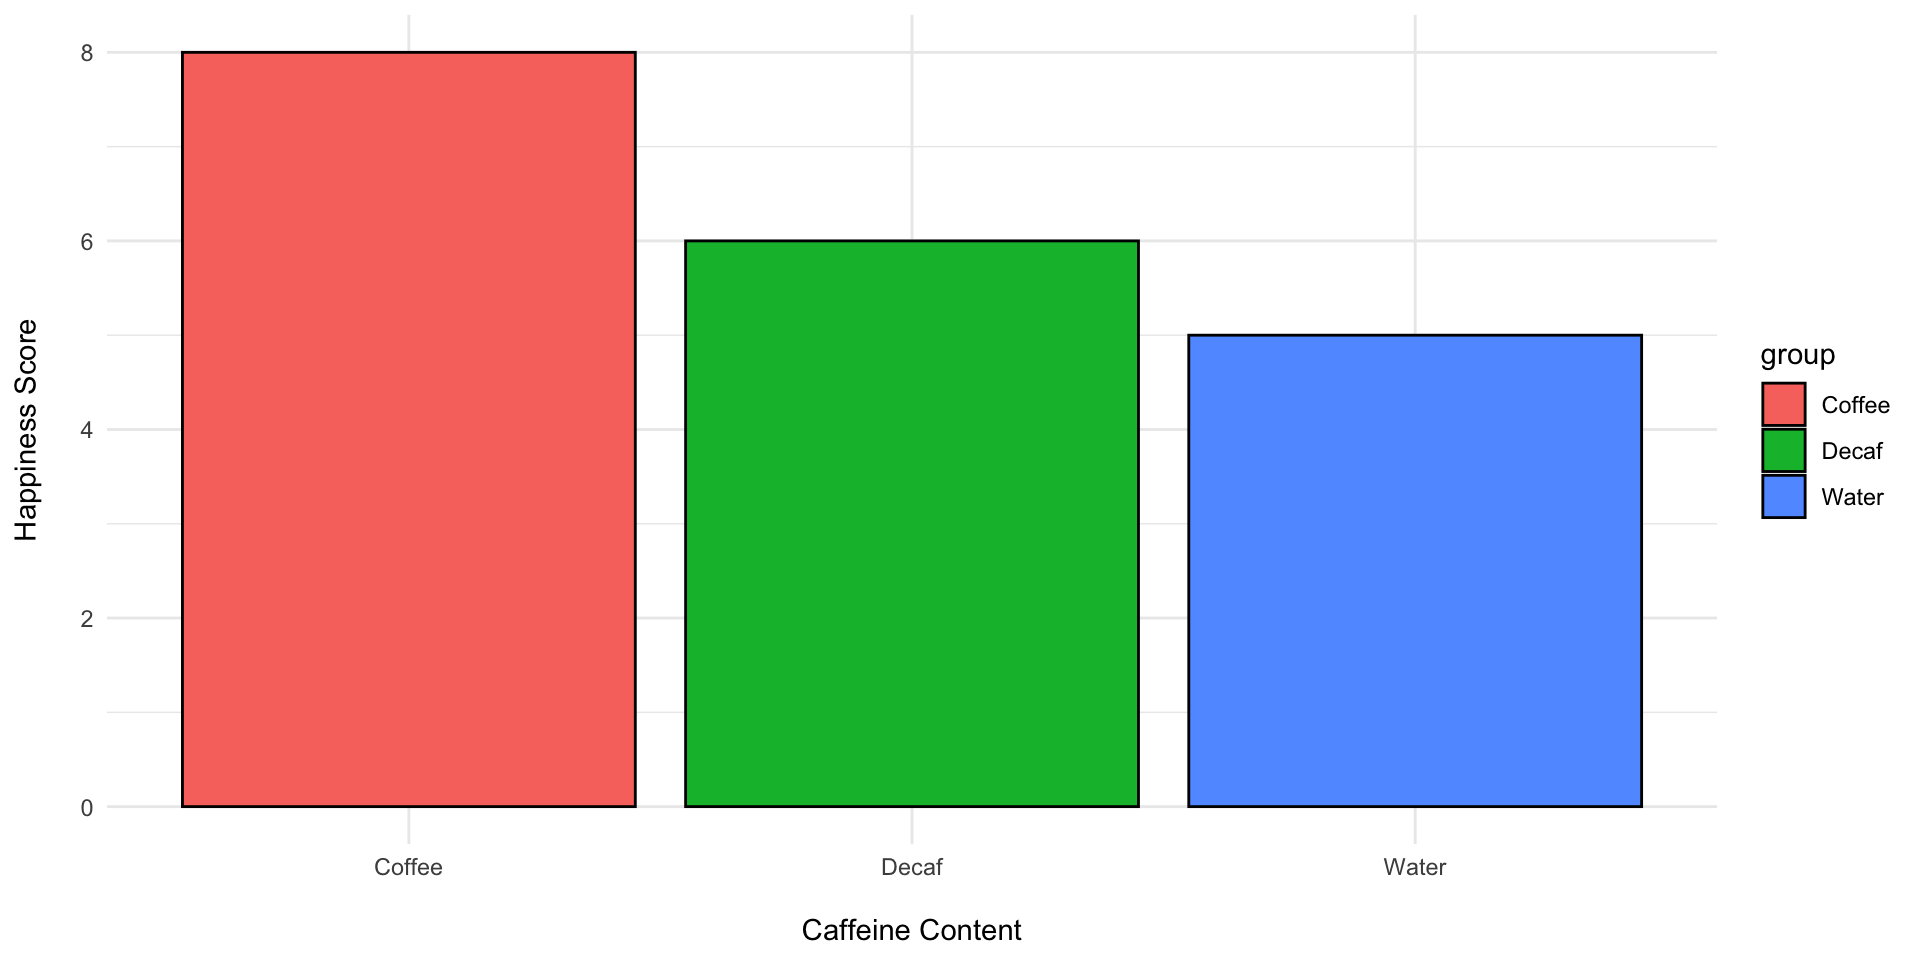
Three groups (coffee, decaf, water), 30 people each, happiness rated 1 to 10.
What is \(H_0\)?
- \(H_0: \mu_\text{Coffee} = \mu_\text{Placebo} = \mu_\text{Control}\)
What is \(H_A\)?
- \(H_A: \mu_\text{Coffee} > \mu_{\text{Placebo}} > \mu_\text{Control}\)
Between subjects ANOVA
Coffee Example Vol. 2: Group Means
Three groups (coffee, decaf, water), 30 people each, happiness rated 1 to 10.
The experimental group has a mean happiness score
8The placebo group mean happiness score
6The control group mean happiness score
5- Is the group that drank coffee significantly happier than the other groups?
Coffee Example Vol. 2
Visualize
Coffee Example Vol. 2
Why Not Do More T-Tests?
Recall that our \(\alpha\) level is set at .05.
If we want to find out whether coffee affects happiness, we’d need three t-tests:- \(t_1: \mu_\text{Coffee} > \mu_\text{Placebo}\)
- \(t_2: \mu_\text{Coffee} > \mu_\text{Control}\)
- \(t_3: \mu_\text{Placebo} > \mu_\text{Control}\)
Why Not Do More T-Tests?
The Problem
Each test is done independently
None accounts for the shared variability across all groups.
By running multiple t-tests, we increase the probability of a false positive (Type I error) and ignore the combined structure of the data.
ANOVA solves both problems by analyzing all groups at once, partitioning total variance into between-group variance (differences due to the treatment)
and within-group variance (random variation).
Why Not Do More T-Tests?
Alpha Inflation
Each hypothesis has a 5% chance of a false positive.
When we test them one-by-one, those chances accumulate, increasing the overall risk of error.
Familywise Error Rate (FWE):
\(\alpha_\text{FWE} = 1 - (1 - \alpha)^k\)
\(\alpha_\text{FWE} = 1 - (0.95)^3 = 0.1426 \approx 14\%\)
Even though each test uses \(\alpha(.05)\), the overall chance of finding at least one “significant” difference by chance jumps to ~15%.
Why Not Do More T-Tests?
The Takeaway
ANOVA protects against this inflation by giving us one overall test of group differences (F-statistic), keeping our Type I error at the intended 5%.
| D | Mean1 | Mean2 | t | p | df | conf.low | conf.high |
|---|---|---|---|---|---|---|---|
| 2.467 | 8.333 | 5.867 | 9.542 | <.01 | 58 | 1.949 | 2.984 |
| 3.4 | 8.333 | 4.933 | 15.028 | <.01 | 58 | 2.947 | 3.853 |
| −0.933 | 4.933 | 5.867 | −3.636 | <.01 | 58 | −1.447 | −0.419 |
Between subjects ANOVA
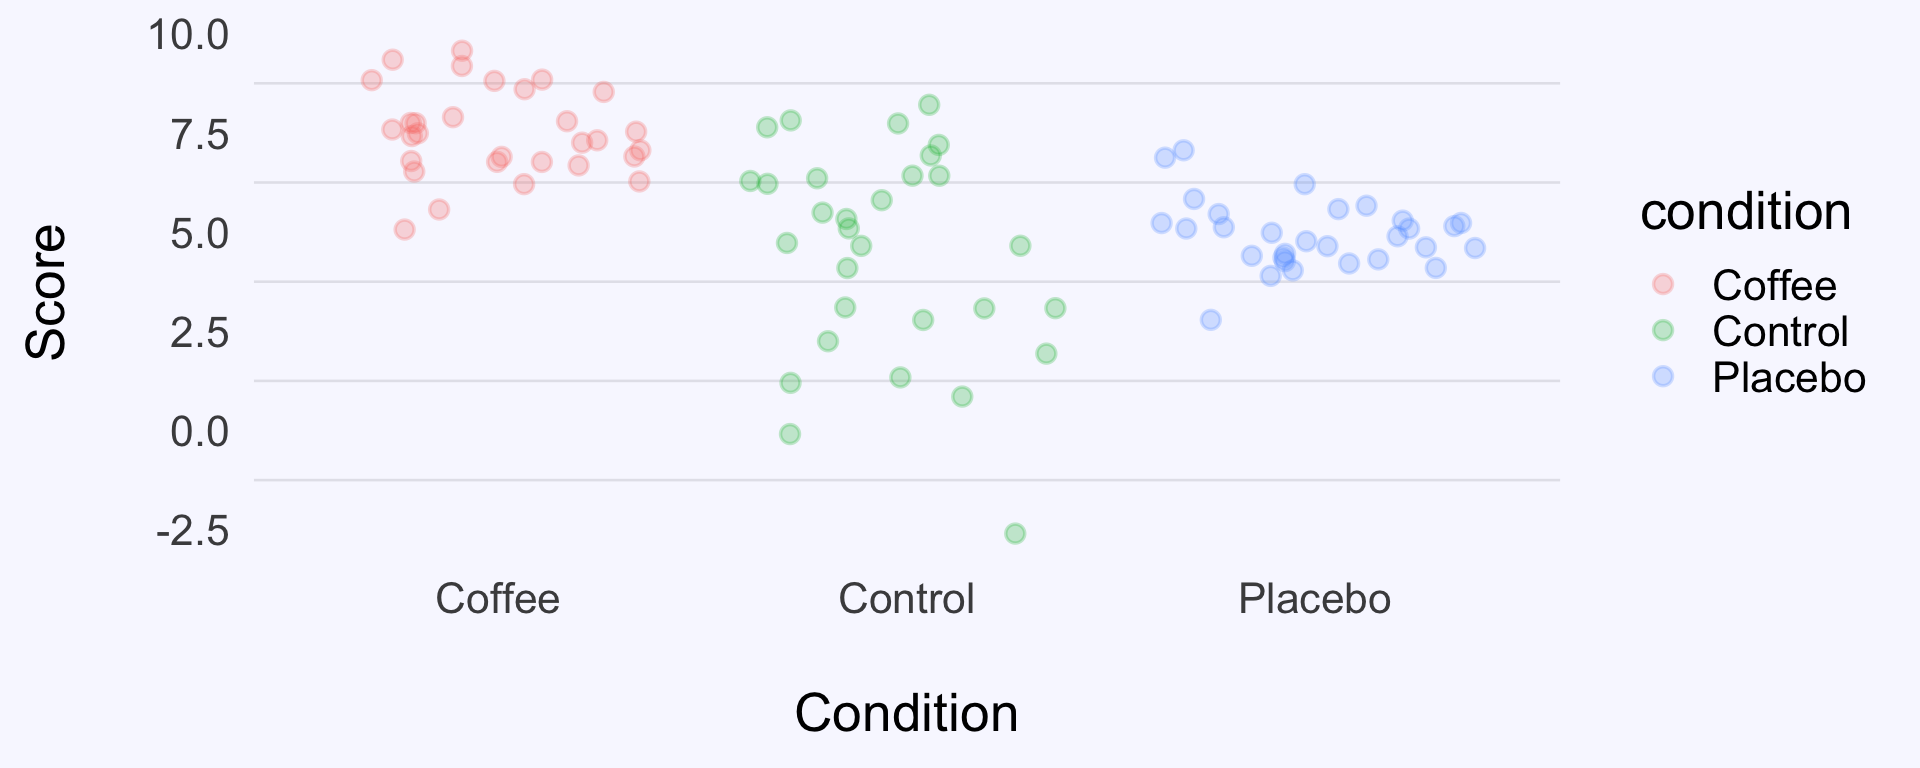
Is the variance between the green, red, and blue dots greater than the variance across all of the dots?
Is the variability between groups large enough, relative to the variability within groups, to suggest that group means truly differ?
Between subjects ANOVA
Is the variance between the green, red, and blue dots greater than the variance across all of the dots?
| Characteristic | Coffee N = 301 |
Control N = 301 |
Placebo N = 301 |
|---|---|---|---|
| score | 7.50(1.22, 1.11) | 4.47(7.08, 2.66) | 4.94(0.76, 0.87) |
| 1 Mean(Variance, SD) | |||
Between subjects ANOVA
- If it’s all about the means, why is it called Analysis of Variance?
- To compare the means, we are analyzing two types of variance:
- Variance among all of the scores (error group variance)
- Variance between the groups (between group variance).
The F Statistic
ANOVA produces what we call the F statistic.
Why do we call it F?
- Ronald Fischer ™
Calculating F
ANOVA Formula
\(F = \frac{MS_B}{MS_E} \\ MS_B = \frac{SS_B}{df_B} \quad MS_E = \frac{SS_E}{df_E} \\ df_B = k-1 \quad df_E = N - k\)
\(MS\) = Mean Square, \(SS\) = Sum of Squares
\(_B\) = Between Group Variance, \(_E\) = Within Group Variance (Error)
\(k\) = Number of groups, \(N\) = Number of participants
Calculating F
Calculating the variance
ANOVA looks at variance. To calculate the Variance:
Variance
\(\Large{s^2 = \frac{\sum(x-\bar{x})^2}{n-1}}\)
Divide by (degrees of freedom).
- This is the variance, but in ANOVA we also call it a Mean Squared (MS).
Calculating means squared (SS)
\(MS = \frac{SS}{df}\)
Calculate the SS.
Divide the SS by the degrees of freedom.
Calculating means squared (MS)
We will calculate a SS for the between group variance.
- How much variance in the data is from group differences?
We will calculate a SS for all the data.
- How much variance in the data is from random error?
Between subjects ANOVA
\(SS_{BG}\) = How much variance comes comes from the group differences?
\(SS_{Error}\) = How much variance is there in total among all the data points?
Calculating means squared (MS)
\(MS_B = \frac{SS_B}{df_B} \\ MS_E = \frac{SS_E}{df_E}\)
- Divide the SS by their degrees of freedom.
Degrees of Freedom
The Group Project
Imagine a group of 5 students is submitting a project, and the total score for the group must be 100 points combined.
The first
4students can choose any score they want — say,15,20,25, and10.But the 5th student’s score isn’t free anymore. It must be whatever makes the total =
100. In other words, only 4 scores are “free to vary.”That’s
n − 1 = 4degrees of freedom.
Degrees of Freedom
Between Groups (\(df_{B}\)) = k - 1
Within Groups (\(df_E\)) = N - k
- k is the number of groups in the independent variable.
Total \(df_{Total}\)= N - 1
Calculating the Means Squared (MS)
\(MS_B = \frac{SS_B}{df_B}\)
\(MS_E = \frac{SS_E}{df_E}\)
Calculating Between subjects anova
- \(\Large{F = \frac{MS_B}{MS_E}}\)
Between subjects anova Example
Prof Brocker gives one group of
100participants theSuper Secret Limitless Drug. He gives another group of100participants aplacebo. He gives the third group of100participantsnothing. All participants then complete an IQ test. He wants to know if those who took theSSLDhave significantly higher IQ than the placebo and the control groups.
What is the IV?
How many levels does it have?
What is the DV?
Between subjects ANOVA Example
Answers
Prof Brocker’s SSLD study: three groups of 100 (SSLD, placebo, nothing), then an IQ test.
What is the IV?
- Drug Taken
How many levels does it have?
- 3 [SSLD, Placebo, Nothing]
What is the DV?
- IQ Score
Between subjects ANOVA Example
Prof Brocker gives one group of
100participants theSuper Secret Limitless Drug. He gives another group of100participants aplacebo. He gives the third group of100participantsnothing. All participants then complete an IQ test. He wants to know if those who took theSSLDhave significantly higher IQ than the placebo and the control groups.
Interpreting F
\(MS_B\) is made up of \(MS_E\) + the theoretical difference between groups:
\(MS_B = \text{group difference} + MS_E\)
\(MS_B = \text{group difference (0)} + MS_E\)
\(MS_B = MS_E\)
\(F = \frac{MS_B}{MS_E}\)
\(F = 1\)
Interpreting f
- When \(F < 1\), it’s not likely to be significant.
Interpreting f
The MSBG is made up of the MSError + the theoretical difference between groups:
\(MS_B = \text{group difference} + MS_E\)
\(MS_B = \text{(Number > 0)} + MS_E\)
\(F = \frac{\text{Difference} + MS_E}{{MS_E}}\)
\(F = Difference\)
Hypothesis testing: ANOVA
\(F \le 1\) = Fail to reject the Null Hypothesis
\(F \gt 1\) = Refer to p-value, Reject the Null Hypothesis
Reporting F
If asked to report findings in terms of the Null Hypothesis (H0), you should report findings as:
Reject \(H_0\), or
Fail to Reject \(H_0\)
Reporting F
If asked to report findings in general or for publication, you need to report 5 things:
F(df for the between group MS, df for the error MS)
F-value
p-value
Mean and standard deviation of each group
Reporting F
The group that watched took the SSLD (M=118.43, s=1.02) did not report significantly higher IQ compared to their peers in the control group (M=116.12, s=0.98), and the placebo group (M=114.2. s =.91), F(2,297) = .912, p = 0.25.
Reporting F
There was not a significant difference in happiness between the groups, F (2, 297) = .912, p = 0.25.
Identifying Degrees of Freedom
One-Way ANOVA, Equal Groups
A researcher compares three different study methods (flashcards, rereading, and practice testing) on exam performance. There are 15 students in each group.
What is \(df_B\)?
- \(k-1 = 3-1 = 2\)
What is \(df_E\)?
\(N = 15 \times 3 = 45\)
\(df_E = N-k = 45-3 = 42\)
Identifying Degrees of Freedom
One-Way ANOVA, Unequal Groups
A psychologist compares four types of therapy for anxiety. Group sizes are
10,12,14, and9participants.
What is \(df_B\)?
What is \(df_E\)?
Identifying Degrees of Freedom
Unequal Groups: Answer Key
\(k = 4\) groups, so \(df_B = k-1 = 4-1 = 3\)
\(N = 10+12+14+9 = 45\) participants
\(df_E = N-k = 45-4 = 41\)
PSY 348 - Statistics for Psychology