Welcome to Statistics for Psychology!

PSY 348: Lecture 1

Dave Brocker

Farmingdale State College

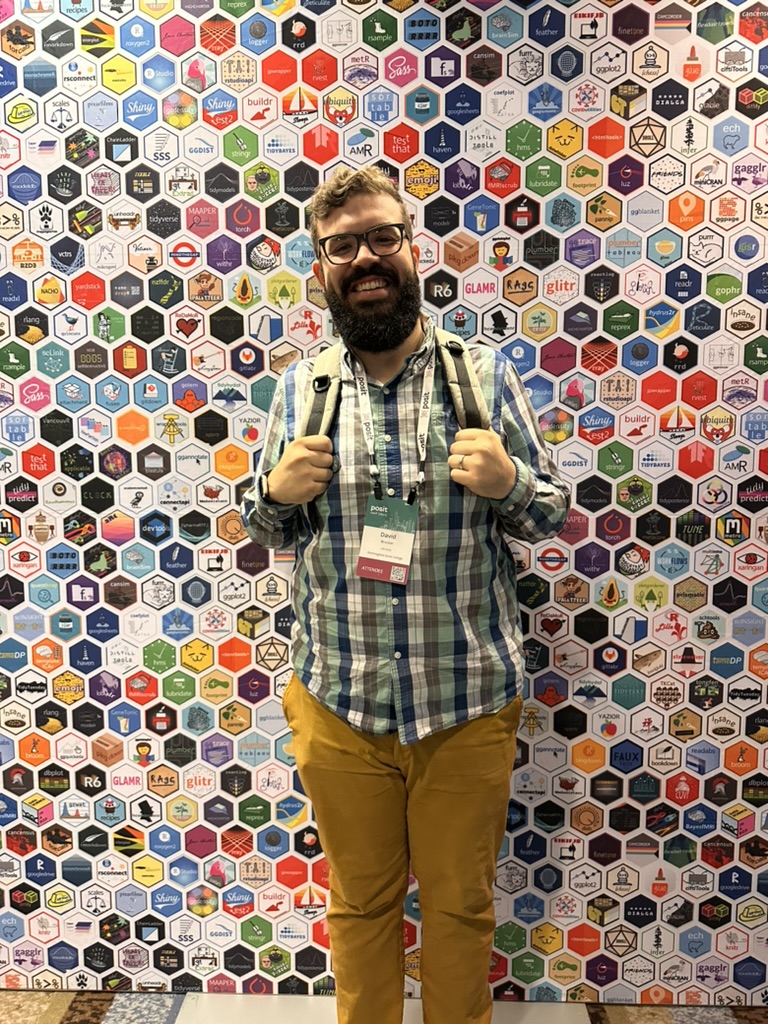
Hi, I’m Dave! ✋

Professor Brocker

7+

Years Teaching

school

Education
M.A. Experimental Psych

psychology

Current Research
Morbid Curiosity & Emotion

edit

Researcher &
Lab Manager

My Teaching Style

What Can You Expect?

  • Humor: I (try) to be funny. Don’t take anything too seriously, we are trying out best here!

  • Interactive: Whenever possible, I favor dynamic content over static content

  • Real-World Examples: We will use a mixture of real and fabricated data to help illustrate ideas

What Have You Disliked About Past Stats Courses? 👎

  • Turn to a neighbor (or shout it out) — what made a past math/stats class miserable?

  • I can’t fix what I don’t know about.

What Are Students Saying?

My Course Evaluations

“Best professor I’ve ever had” | “Made 9am class feel like a mid-day class, not boring” | “Awesome professor, did a great job teaching this class” |“Favorite professor I have had so far” | “Super approachable, understanding, and cares about his students” | “Great instructor — hate statistics”

Outside of Class

Hobbies and Media

Statistics

About the Course

Statistics is the science of collecting, analyzing, and interpreting data to make informed decisions.

  • As a practitioner, your practices need to be informed by evidence-based treatments

  • As a researcher, your claims need to be supported by evidence that can assert a high probability of a relationship or cause and effect

  • Because data is everywhere, even in your Netflix recommendations!

Stats Statistics Prac Practitioner (evidence-based treatment) Stats->Prac Res Researcher (cause & effect claims) Stats->Res Every Everyday Life (Netflix, reviews, news) Stats->Every

What is Statistics?

Definition and Terminology

Statistics
Describing, analyzing, and making inferences from data (a sample or a population)
Describing
What does the data ‘look’ like?
Analyzing
A mathematical approach to extracting information from data
Inferences
Predicting what might happen next, typically extrapolating from a sample to the population
Data
Qualitative or quantitative information that consists of measured or manipulated variables
Sample
A subset of the population of interest
Population
The entire set of interest

Why is it Important?

When Do I Use It?

Everywhere!

Statistics makes appearances anywhere you see information being summarized or being used to make decisions.

  • directions_car Purchasing a car

    • You look at reviews and infer the overall takeaway of how ‘good’ or ‘bad’ a car might be.
  • restaurant Going to a restaurant

    • You base your selection on prior experiences or on reviews/opinions from people you trust
  • how_to_vote Voting for a candidate

    • You look for increases in wages and decreases in taxes
  • local_movies Going to the Movies

    • You pick a movie based on genre, past experiences, and reviews

Data Literacy

Why Do I Need It

Statistical and data literacy is useful for being able to make informed decisions — especially when a claim is designed to grab your attention before you’ve had a chance to think it through.

  • If you saw a headline claiming that blueberries could cure cancer, wouldn’t it be helpful to know how to evaluate that claim before sharing it?
  1. How many blueberries, and how “cancer” was even measured?
  2. How long do you have to eat them for?
  3. Is it all types of cancer or a specific one?
  4. Is it truly that blueberries cure cancer, or are they mixed in with something else (diet, exercise, a specific compound at a dose no one eats naturally)?

This is the same skill you’ll use on every “coffee causes/cures ___” headline for the rest of your life.

Too Good to Be True

Wouldn’t it be nice if…

We tend to describe the world the way we wish it were, not always the way it actually is. A few examples of that:

  • Dogs smiled (that “smile” is often a stress signal, not happiness)

  • Birdsong is always beautiful (some of it is territorial alarm-calling)

  • All animals love their children (infanticide is documented across many species)

Our brain is a pattern matching machine

  • We look for information that confirms our thoughts and surroundings

  • We would (often) prefer that things were nice and pretty, but reality is often not so simple

What is your future career goal?

Statistics in Psychology

How Each Profession Uses Data

  • Mental Health Counselors/Social Workers

    • Knowing that a certain percentage of college students suffer from Anxiety, you can improve your outreach and provide material aimed to address and reduce the impact
  • Human Resources/Training and Development

    • If 30% of employees report that there are so few incentives and little to no sense of belonging, you can take actionable steps to address those issues
  • Researchers (Hey That’s What I do!)

    • Hypotheses are only supported when the data suggests that the findings are unlikely to have occurred by chance.
  • Academia (Hey That’s What I do!)

    • If the Average Exam score is an 85 with a Standard Deviation of 20 points, I have reason to believe that the test was either too difficult or the material was not explained well enough

Raise your hand if you dislike math

Goals for this Class:

  1. Be comfortable looking at data and making inferences
  2. Be comfortable looking at graphs and making inferences and gathering takeaways
  3. Reading scientific and popular articles and critically thinking about the claims being made
  4. Understand what constitutes evidence and what it means for hypotheses to be supported
  5. Understand that research is probabilistic

Why Do I Even Need This Course, I’m Going to Be A…

Why Should You Care?

  • Therapist:
    • Your practices need to be informed by evidence-based treatments
  • Researcher:
    • Your claims need to be supported by evidence that can assert a high probability or relationship or cause and effect.
  • Non-Data Field:
    • Because data is everywhere, even in your Netflix recommendations!

Watch User Watching Content Collect Collect Viewing Data Watch->Collect Analyze Analyze Preferences Collect->Analyze History Viewing History Collect->History Genres Genres & Tags Collect->Genres Similar Similar Users Collect->Similar Engine Recommendation Engine Analyze->Engine Rec Recommended Movies/Shows Engine->Rec Trend Trending Content Engine->Trend Picks Personalized Picks Engine->Picks

What You’ll Learn This Semester

Introduction to Research

  • Descriptive Statistics
    • What does the data ‘look like’?
  • Probability is Paramount
    • What are the chances this happens and what is the probability this only happens because of chance?
  • Testing hypotheses
    • If [condition] has this specific attribute, we expect [event] to take place.
  • Correlation, regression, and causation
    • How are variables related to each other?
    • How much can variables predict each other?
    • Does this variable cause a change in this other component?

Syllabus

How This Class Works

forum

Participation

Asking questions helps you understand – and will likely help your classmates too!

edit_note

Homework

Practice outside of the classroom, kept low-stakes.

science

Labs

A weekly hands-on session right after lecture, applying that week’s concepts in R.

fact_check

Exams

A decent (not perfect) way to see how well you understand and can apply the material.

Full syllabus, grading breakdown, and office hours are posted on Brightspace — take a few minutes to skim it before next class.

Research Design

Lecture 1

What is Research?

Research is a systematic process of asking a question about the world and collecting evidence to answer it — as opposed to relying on intuition, anecdote, or “everybody knows that…”

  • It’s systematic: it follows a planned, repeatable process (not a one-off guess).

  • It’s testable: it produces a claim that data could, in principle, prove wrong.

  • It’s shareable: the methods and data are reported clearly enough that someone else could check your work.

What is Research?

The Basic Cycle

A 1. Observe something interesting B 2. Ask a specific, answerable question A->B C 3. Form a hypothesis B->C D 4. Collect data C->D E 5. Analyze the data (this is where statistics comes in!) D->E F 6. Draw a conclusion E->F F->A often leads to the next question

What Kinds of Research are there?

Descriptive Research

  • Goal: describe what’s happening, without testing cause and effect

  • Examples: case studies, naturalistic observation, surveys

  • Tells you what is going on, but not why

description

Case Studies

visibility

Observation

poll

Surveys

What Kinds of Research is there?

Correlational Research

  • Goal: measure whether two variables are related to one another

  • You observe variables as they naturally occur — nothing is manipulated

  • Lets you predict one variable from another, but cannot establish that one causes the other

scatter_plot

Relationship

compare_arrows

Two Variables

block

Not Causation

What Kinds of Research is there?

Experimental Research

  • Goal: test whether one variable causes a change in another

  • The researcher manipulates an independent variable (IV) and measures a dependent variable (DV)

  • Participants are (ideally) randomly assigned to conditions, and other variables are controlled

  • This is the only design type that can support a causal claim

tune

Manipulate IV

shuffle

Random Assignment

verified

Causal Claim

What Kinds of Research Are there?

Putting the Vocabulary Together

  • Independent Variable (IV): what the researcher manipulates (or the grouping variable)

  • Dependent Variable (DV): what the researcher measures — the outcome

  • Participants, Materials, Procedure, Design: the four building blocks you’ll use to describe how a study was run

  • You’ll get hands-on practice with this vocabulary in Lab 1, when we write a Method section together.

Any Questions?

I Am an Open Book!

📕📖