| Characteristic | Beta | 95% CI | p-value |
|---|---|---|---|
| Cups_of_Coffee | 1.2 | 1.0, 1.4 | <0.001 |
| sleep_quality_num | 3.3 | 2.4, 4.1 | <0.001 |
| Study_Time | 0.47 | 0.39, 0.56 | <0.001 |
| Abbreviation: CI = Confidence Interval | |||
Two or More Variables
Farmingdale State College
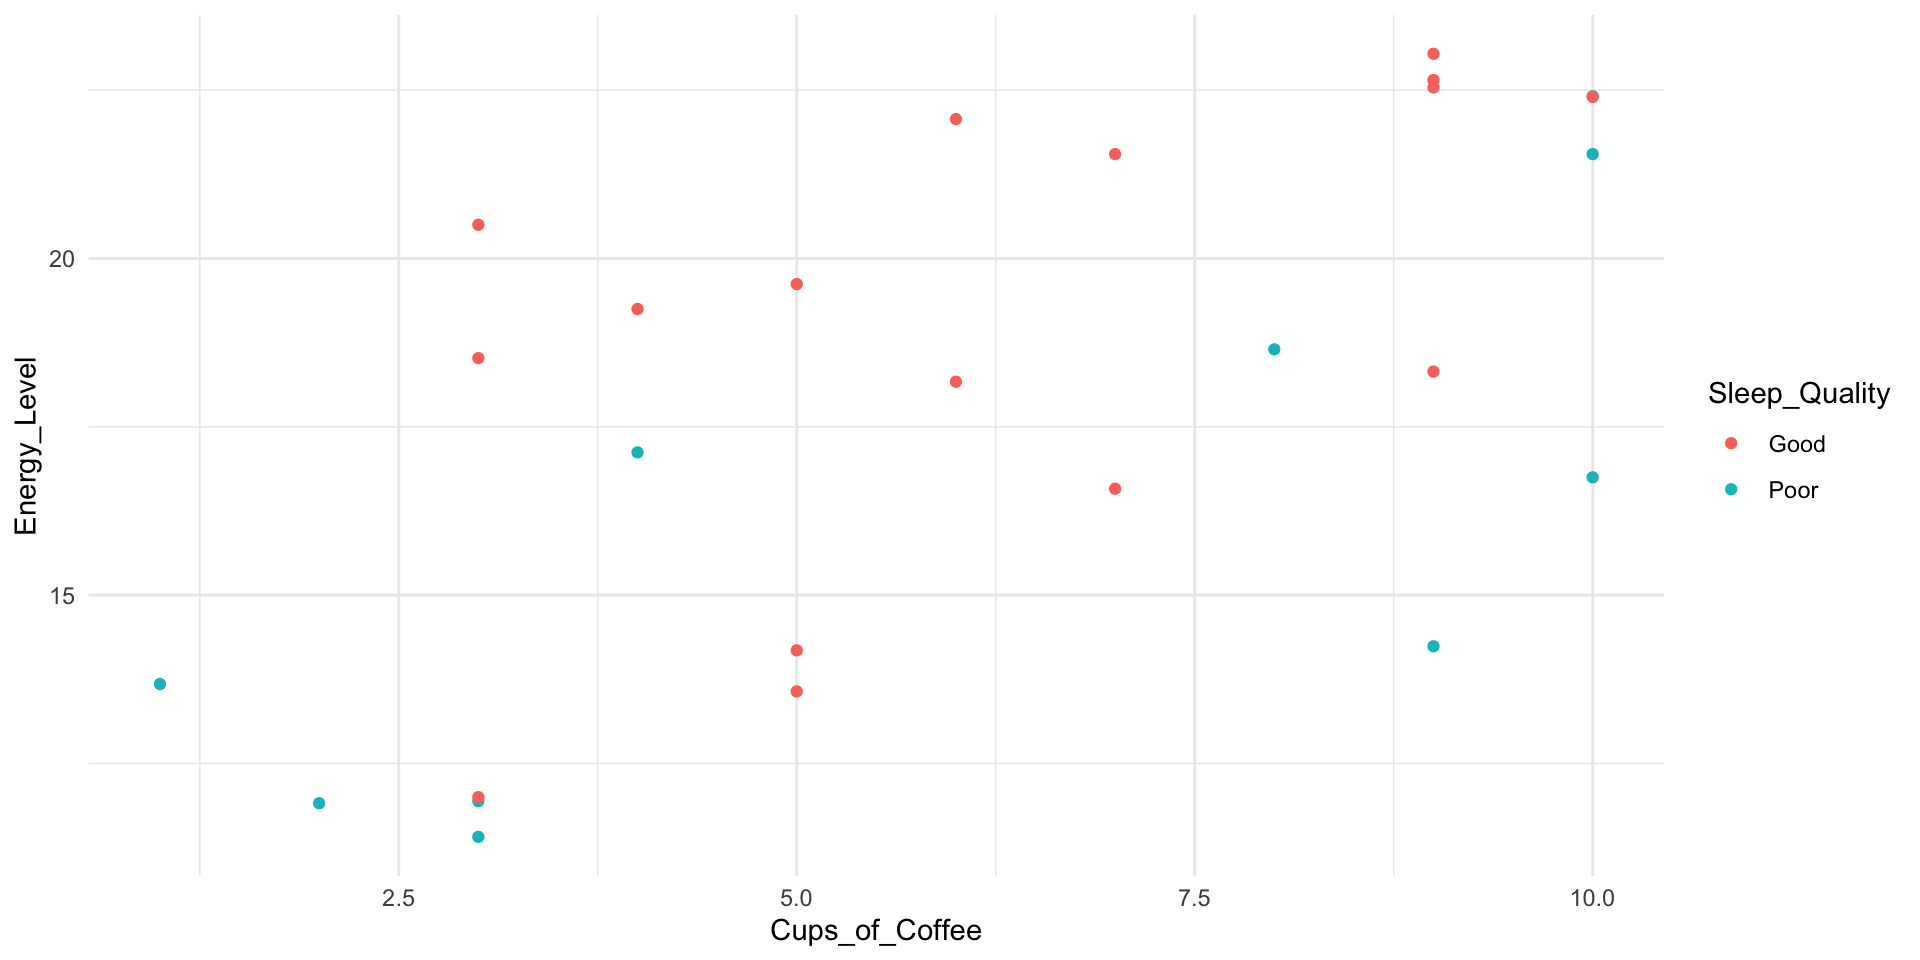
How many cups of coffee do you drink per day? Do you feel more awake when you drink more?
Simple regression equation
\(\text{Energy Level} = \text{Intercept} + (\text{Slope} \times \text{Cups of Coffee}) = 2.62 + 1.25(\text{Cups})\)
Slope (1.25): for each additional cup of coffee, the predicted energy level increases by about 1.25 points.
Intercept (2.62): the predicted energy level when no coffee is consumed (cups = 0).
Question:
“Based on our regression equation:
\[ \text{Energy Level} = 2.62 + 1.25(\text{Cups of Coffee}) \]
what do you predict the energy level will be for a student who drinks 10 cups? 20 cups?”
| Characteristic | Beta | 95% CI | p-value |
|---|---|---|---|
| Cups_of_Coffee | 1.2 | 1.0, 1.4 | <0.001 |
| sleep_quality_num | 3.3 | 2.4, 4.1 | <0.001 |
| Study_Time | 0.47 | 0.39, 0.56 | <0.001 |
| Abbreviation: CI = Confidence Interval | |||
\(\hat{Y} = 3.63 + 1.20(A) + 3.26(B) + 0.47(C)\)
\(A\) = Cups_of_Coffee (continuous)
\(B\) = Sleep_Quality (categorical: 0 = “Poor”, 1 = “Good”)
\(C\) = Study_Time (continuous)
Each cup of coffee adds 1.20 to predicted energy; good sleep adds 3.26 (poor sleep adds nothing); each extra unit of study time adds 0.47, each holding the others constant.
\(\hat{Y} = \beta_0 + \beta_1 A + \beta_2 B + \beta_3 C\)
⬡⬢⬡⬢⬡⬢⬡⬢⬡⬢⬡⬢