[1] 12 16 15 4 9 15 9 9 14 21 10 18
n mean sd
12.000000 12.666667 4.716187
Testing a Sample Mean When σ Is Unknown
Farmingdale State College
\[z = \frac{\bar{x} - \mu}{\sigma / \sqrt{n}} \qquad\qquad t = \frac{\bar{x} - \mu}{s / \sqrt{n}}\]
Last lab we knew the population standard deviation \(\sigma\), so we used z
Usually we do not know \(\sigma\), so we estimate it with the sample standard deviation \(s\) and use t
The t distribution has fatter tails than z, and it depends on the degrees of freedom: \(df = n - 1\)
Same habit as before: write every argument by name
\[s = \sqrt{\frac{\sum (x - \bar{x})^2}{n - 1}}\]
Numerator: every score’s squared distance from the mean, added up
Denominator: \(n - 1\), and then we take the square root
\(\dfrac{s}{\sqrt{n}}\) is the estimated standard error: how much sample means bounce around
A national survey says college students spend
9hours a week studying outside of class. We asked12PSY 348 students how many hours they studied last week.
\(H_0: \mu = 9\) (our students study the same as the national average)
\(H_A: \mu \neq 9\) (they study a different amount: a two-tailed test)
\(\alpha = .05\)
We do not know \(\sigma\), so this is a one-sample t-test
\[t = \frac{\bar{x} - \mu}{s/\sqrt{n}} = \frac{12.67 - 9}{4.72/\sqrt{12}} = \frac{3.67}{1.36} = 2.69\]
\(df = n - 1 = 12 - 1 = 11\)
The two-tailed critical value for \(df = 11\) is \(\pm 2.20\)
\(|2.69| > 2.20\), so we expect to reject \(H_0\)
t_by_hand.R
mu_0 <- 9 # the value in H0
n <- length(x = study_hours)
m <- mean(x = study_hours)
s <- sd(x = study_hours)
se <- s / sqrt(x = n) # estimated standard error
t <- (m - mu_0) / se
df <- n - 1
# Two-tailed p: area beyond |t| in one tail, doubled
p <- 2 * pt(q = abs(x = t), df = df, lower.tail = FALSE)
# Critical value: the t that leaves 2.5% in each tail
t_crit <- qt(p = 0.975, df = df, lower.tail = TRUE)
c(se = se, t = t, df = df, p = p, t_crit = t_crit) se t df p t_crit
1.36144605 2.69321481 11.00000000 0.02090871 2.20098516
t.test()t_test.R
Same t, df, and p as our step-by-step version
alternative can be "two.sided", "less", or "greater"
The confidence interval (about 9.67 to 15.66) does not contain 9: another way to see the rejection
Click Code to see how the plot is built.
library(ggplot2)
curve_df <- data.frame(x = seq(from = -4, to = 4, by = 0.01))
curve_df$y <- dt(x = curve_df$x, df = 11)
ggplot(data = curve_df, mapping = aes(x = x, y = y)) +
geom_line(linewidth = 1.1) +
geom_area(data = subset(x = curve_df, subset = x >= abs(x = t)), fill = "orange", alpha = 0.6) +
geom_area(data = subset(x = curve_df, subset = x <= -abs(x = t)), fill = "orange", alpha = 0.6) +
geom_vline(xintercept = c(-t_crit, t_crit), linetype = "dashed") +
theme_minimal(base_size = 18) +
labs(
title = "t Distribution (df = 11): Shaded Area Is the Two-Tailed p-Value",
x = "\nt", y = "Density\n"
) +
theme(panel.grid = element_blank())\[d = \frac{\bar{x} - \mu}{s} = \frac{12.67 - 9}{4.72} = 0.78\]
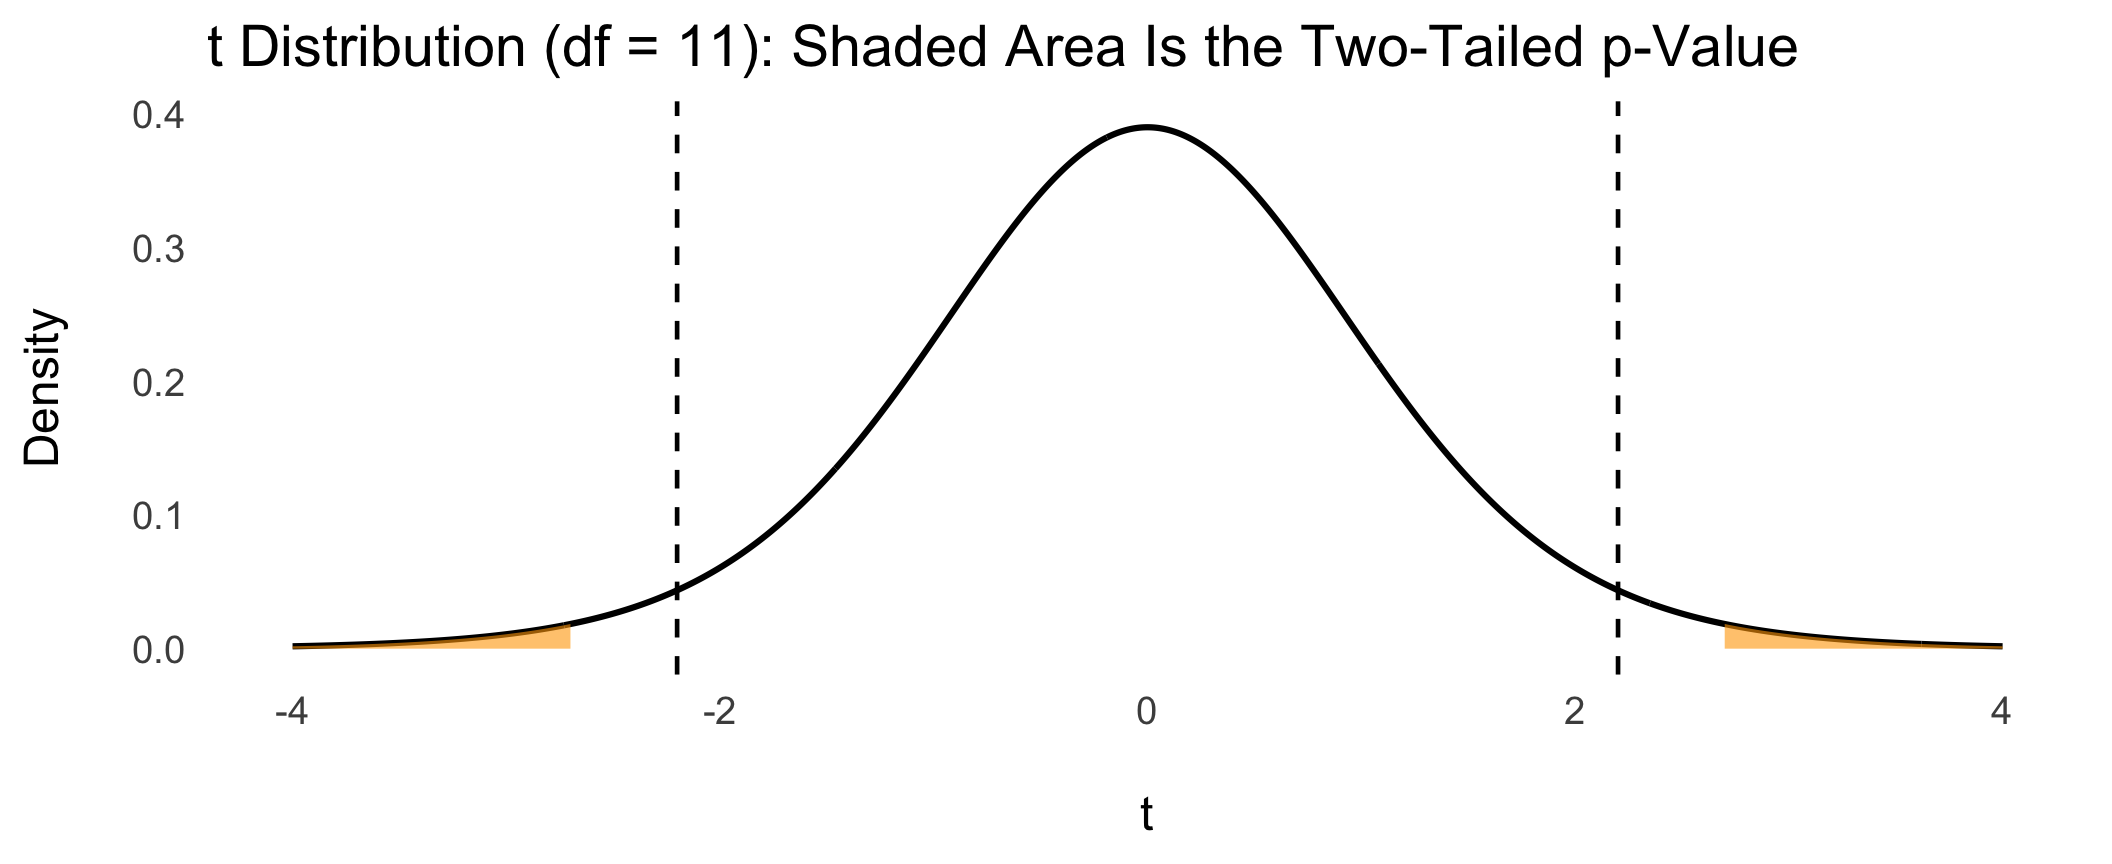
Students studied more than the national average of 9 hours, M = 12.67, SD = 4.72, t(11) = 2.69, p = .021, d = 0.78.
By the usual benchmarks, \(d \approx 0.8\) is a large effect
Sleep researchers recommend at least 7 hours a night. We asked 10 students how many hours they slept last night, and we expect they sleep less than 7.
Write every argument by name. Use \(\mu = 7\) and \(\alpha = .05\).
By hand (use R only for mean() and sd()): find \(\bar{x}\), \(s\), the standard error, and \(t\).
What are the degrees of freedom? Use qt() to find the two-tailed critical value, and the one-tailed critical value for \(H_A: \mu < 7\).
Run t.test() with a two-tailed alternative. Report t, df, p, and the 95% confidence interval. Do you reject \(H_0\)?
Now run t.test() with alternative = "less". How does the p-value change, and does your decision change? Why must you choose one-tailed or two-tailed before looking at the data?
Write an APA-style sentence reporting the result of the one-tailed test, and compute Cohen’s \(d = \dfrac{\bar{x} - \mu}{s}\). Is the effect small, medium, or large?
Your answers to the five questions above (show your R code and output)
One sentence: why do we use \(t\) instead of \(z\) when we do not know \(\sigma\)?
PSY 348 - Statistics for Psychology