  method    score
1  Video 6.939524
2  Video 7.269823
3  Video 9.058708
4  Video 7.570508
5  Video 7.629288
6 Video 9.215065Lab 10: One-Way ANOVA
Which Study Method Works Best?
Dave Brocker
Farmingdale State College
One-Way ANOVA
Concept Review
Compares means across 3+ groups
Used when you want to test if at least one group differs from the others
Tests the null hypothesis that all group means are equal: \(H_0: \mu_1 = \mu_2 = \mu_3\)
Scenario
Three groups of students used different methods to study for a quiz:
- Video lectures
- Reading the textbook
- Flashcards
Each student then took the same 10-question quiz.
- What is the independent variable (IV) here? What is the dependent variable (DV)?
Simulated Data in R
Visualizing Scores
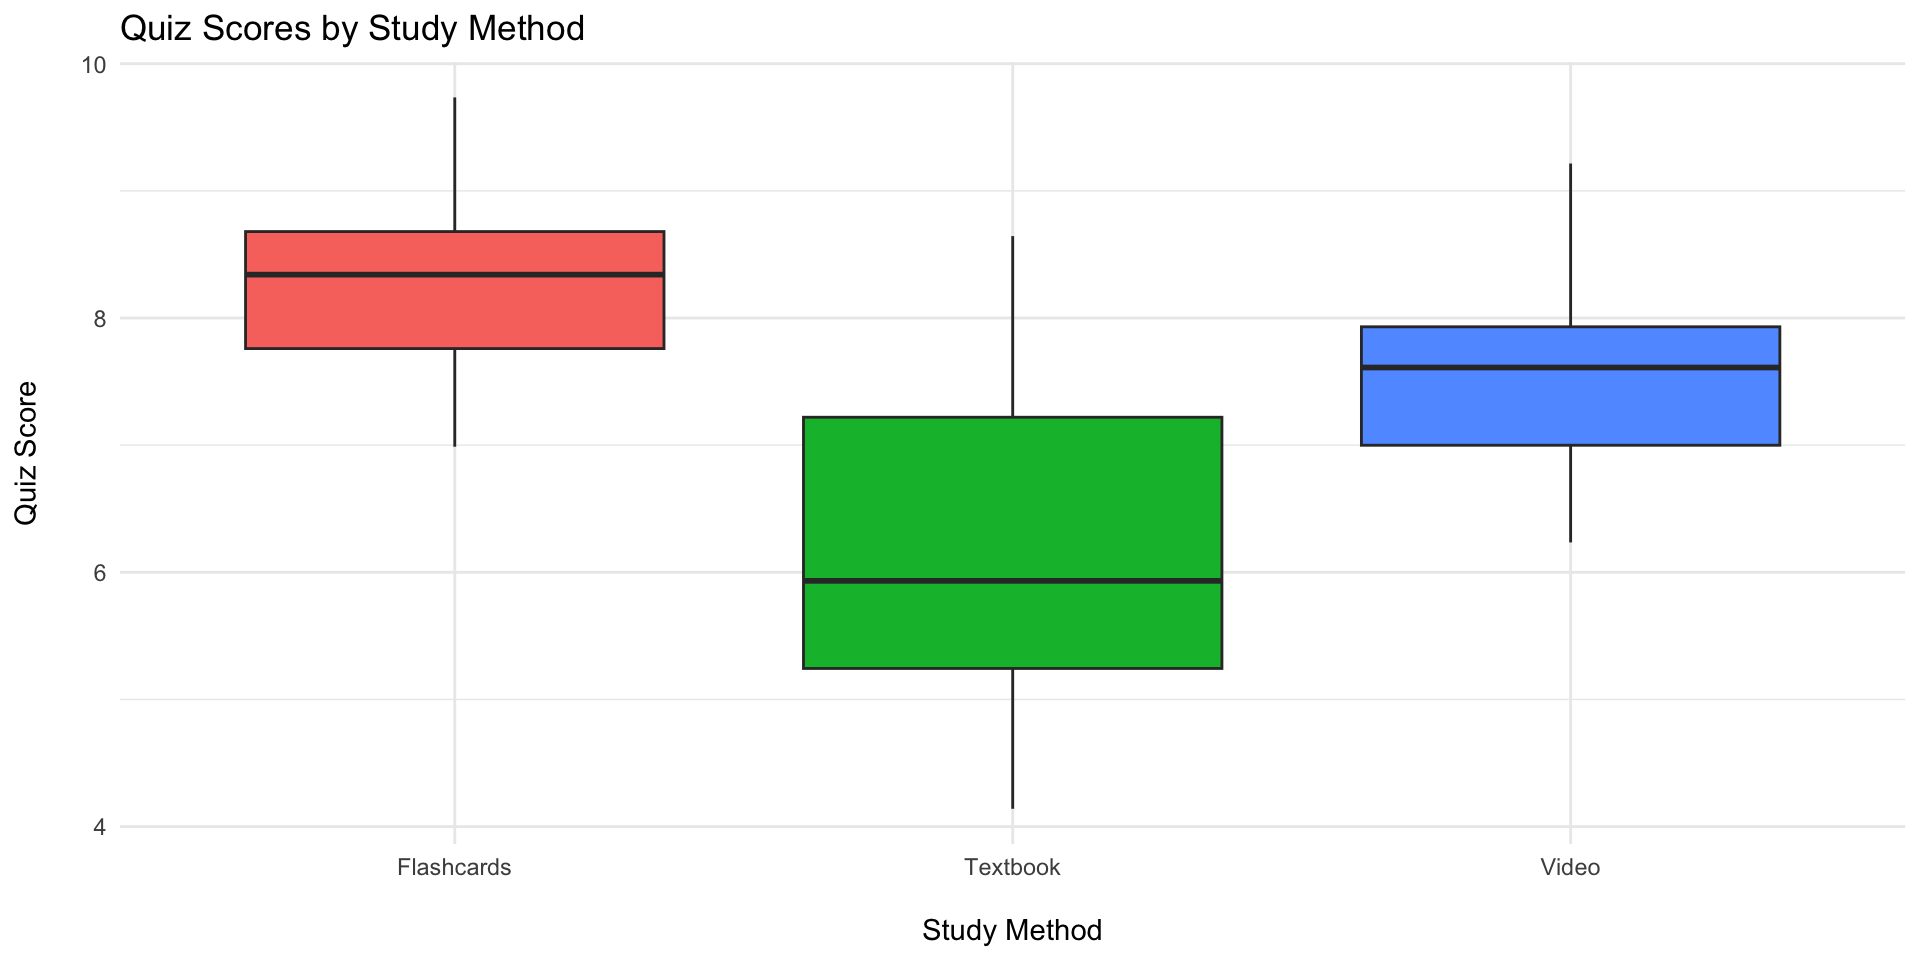
Running the ANOVA
            Df Sum Sq Mean Sq F value   Pr(>F)
method       2  32.84  16.420    16.9 4.12e-06 ***
Residuals   42  40.80   0.972
---
Signif. codes:  0 '***' 0.001 '**' 0.01 '*' 0.05 '.' 0.1 ' ' 1
\[F = \frac{MS_B}{MS_E} = \frac{SS_B / (k - 1)}{SS_E / (N - k)}\]
F is the variance between group means (numerator) divided by the variance within groups (denominator); \(k\) = number of groups, \(N\) = total sample size
Look at the F value and p-value
If \(p < .05\), reject the null hypothesis
Post Hoc: Tukey HSD
  Tukey multiple comparisons of means
    95% family-wise confidence level

Fit: aov(formula = score ~ method, data = study_data)

$method
                          diff        lwr        upr     p adj
Textbook-Flashcards -2.0321418 -2.9065437 -1.1577400 0.0000038
Video-Flashcards    -0.5838473 -1.4582491  0.2905546 0.2476431
Video-Textbook       1.4482946  0.5738927  2.3226964 0.0006718
Shows which pairs of study methods differ significantly
Adjusts for multiple comparisons, so we don’t inflate our Type I error rate by running three separate t-tests
Discussion Prompts
Which group performed best?
Is the difference statistically significant?
Is the difference practically meaningful? (Hint: look back at the boxplot — how much does a 1-point difference on a 10-question quiz actually matter?)
What might influence quiz performance beyond study method?
Wrap-Up
One-way ANOVA compares 3+ means
A significant F-test tells you at least one group differs — Tukey HSD tells you which ones
Real-world applications: education, psychology, marketing, and beyond
Submit on Brightspace
Using study_data, answer:
Report the F-statistic, degrees of freedom, and p-value from your ANOVA.
Which pair(s) of study methods differ significantly per the Tukey HSD test?
In your own words, explain what it would mean if this ANOVA had not been significant.
PSY 348 - Statistics for Psychology